4.6 Summary of the classification methods
4.6.1 An Analytical Comparison
LDA and logistic regression assume that the log odds of the posterior probabilities is linear in x.
QDA assumes that the log odds of the posterior probabilities is quadratic in x.
LDA is simply a restricted version of QDA with \(Σ_1 = · · · = Σ_K = Σ\)
LDA is a special case of naive Bayes and vice-versa!
LDA assumes that the features are normally distributed with a common within-class covariance matrix, and naive Bayes instead assumes independence of the features.
Naive Bayes can produce a more flexible fit.
QDA might be more accurate in settings where interactions among the predictors are important in discriminating between classes.
LDA > logistic regression when the observations at each Kth class is normal.
K-nearest neighbors (KNN) will be better classifiers when decision boudary is non-linear, n is large, and p is small.
KNN has low bias but large variance; as such, KNN requires a lot of observations relative to the number of predictors.
If decision boundary is non-linear but n is and p are small, then QDA may be preferred to KNN.
KNN does not tell us which predictors are important!
Final note. The choice of method depends on (1) the true distribution of the predictors in each of the K classes,(2) the values of n and p - bias-variance trade-off
4.6.2 An Empirical Comparison
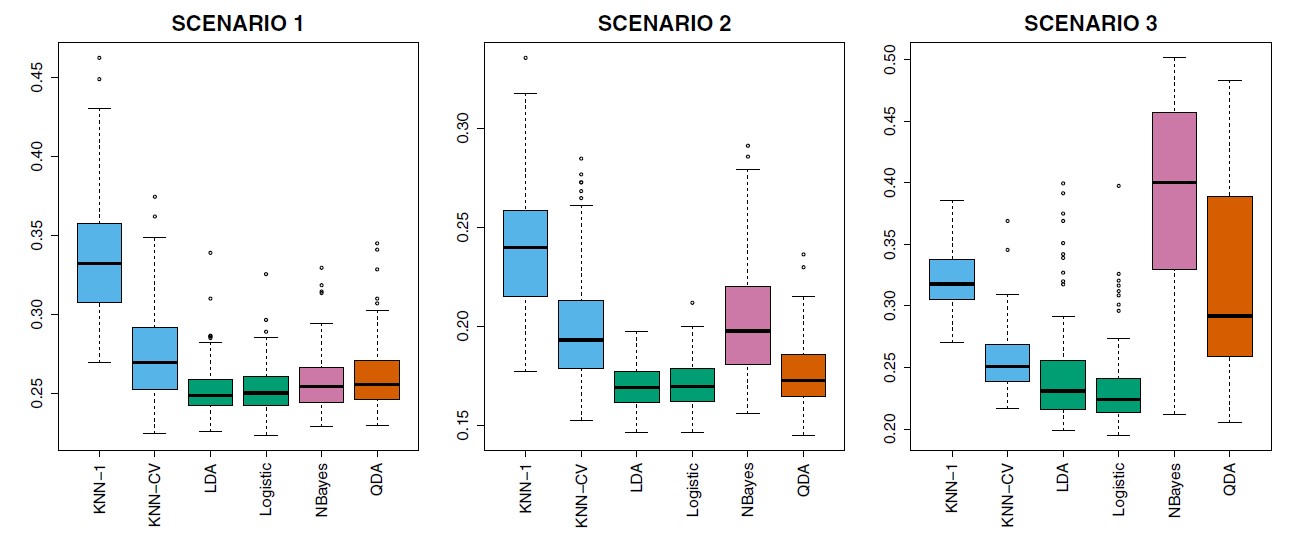
Figure 4.10: Boxplots of the test error rates for each of the linear scenarios described in the main text.
When Bayes decision boundary is linear,
Scenario 1: Binary class response, equal observations in each class, uncorrelated predictors
Scenario 2: Similar to Scenario 1, but the predictors had a correlation of −0.5.
Scenario 3: Predictors had a negative correlation, t-distribution (more extreme points at the tails)
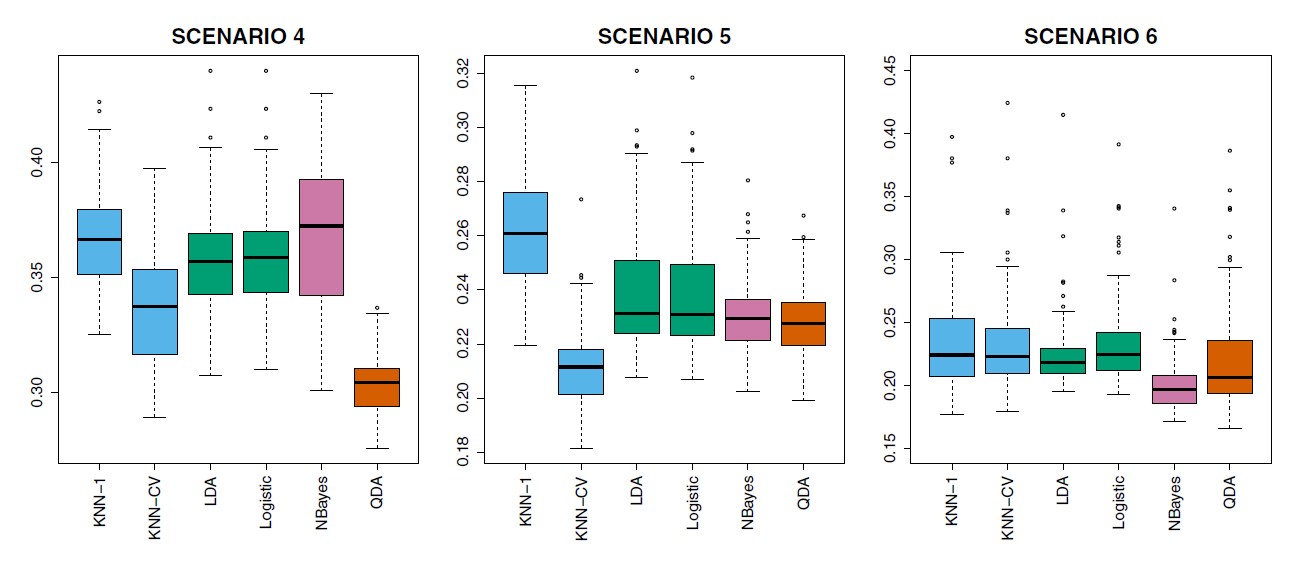
Figure 4.11: Boxplots of the test error rates for each of the non-linear scenarios described in the main text
When Bayes decision boundary is non-linear,
Scenario 4: normal distiibution, correlation of 0.5 between the predictors in the first class, and correlation of −0.5 between the predictors in the second class.
Scenario 5: Normal distribution, uncorrelated predictors
Scenario 6: Normal distribution, different diagonal covariance matrix for each class, small n