5.10 Logistic Polynomial Regression, Bayes Decision Boundaries, and k-fold Cross Validation
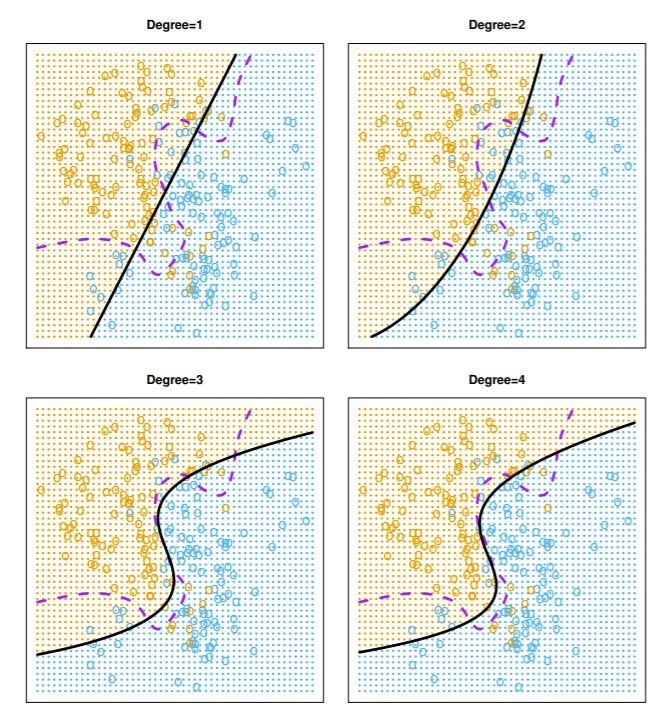
Figure 5.5: Estimated decision boundaries of polynomial logistic regression models for simulated data are shown. The Bayes decision boundary is the dashed purple line.
- In practice, the true test error and Bayes error rate are unknown, so we need to estimate the test error rate.
- This can be done via k-fold cross-validation, which is often a good estimate of the true test error rate.
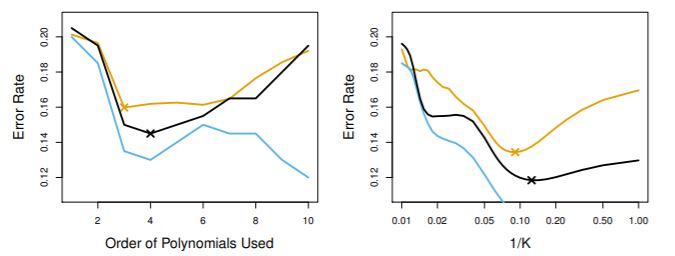
Figure 5.6: The test error rate (beige), the training error rate (blue), and the 10-fold cross validation error rate (black) are shown for polynomial logistic regression and KNN classification.