8.24 Example: Boosting versus random forests
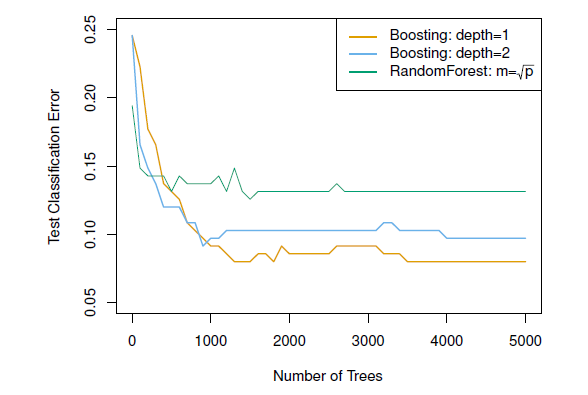
Figure 8.5: Results from performing boosting and random forests on the 15-class gene expression data set in order to predict cancer versus normal. The test error is displayed as a function of the number of trees. For the two boosted models, lambda = 0.01. Depth-1 trees slightly outperform depth-2 trees, and both outperform the random forest, although the standard errors are around 0.02, making none of these differences significant. The test error rate for a single tree is 24 %.
Notice that because the growth of a particular tree takes into account the other trees that have already been grown, smaller trees are typically sufficient in boosting (versus random forests)
Random forests and boosting are among the state-of-the-art methods for supervised learning (but, their results can be difficult to interpret)