8.34 Correlation Analysis
Correlation heatmap (Pearson)
# convert factor features to numeric for correlation analysis
carseats_num <- carseats %>%
     mutate(High = ifelse(High == "No", 0 , 1),
            Urban = ifelse(Urban == "No", 0, 1),
            US = ifelse(US == "No", 0, 1),
            ShelveLoc = case_when(
                 ShelveLoc == 'Bad' ~ 1,
                 ShelveLoc == "Medium" ~ 2,
                 TRUE ~ 3
            ))

carseats_num
## # A tibble: 400 × 11
## CompPrice Income Advertising Population Price ShelveLoc Age Education Urban
## <dbl> <dbl> <dbl> <dbl> <dbl> <dbl> <dbl> <dbl> <dbl>
## 1 138 73 11 276 120 1 42 17 1
## 2 111 48 16 260 83 3 65 10 1
## 3 113 35 10 269 80 2 59 12 1
## 4 117 100 4 466 97 2 55 14 1
## 5 141 64 3 340 128 1 38 13 1
## 6 124 113 13 501 72 1 78 16 0
## 7 115 105 0 45 108 2 71 15 1
## 8 136 81 15 425 120 3 67 10 1
## 9 132 110 0 108 124 2 76 10 0
## 10 132 113 0 131 124 2 76 17 0
## # ℹ 390 more rows
## # ℹ 2 more variables: US <dbl>, High <dbl>library(dlookr)## Registered S3 methods overwritten by 'dlookr':
## method from
## plot.transform scales
## print.transform scalescarseats_num %>%
correlate() %>%
plot()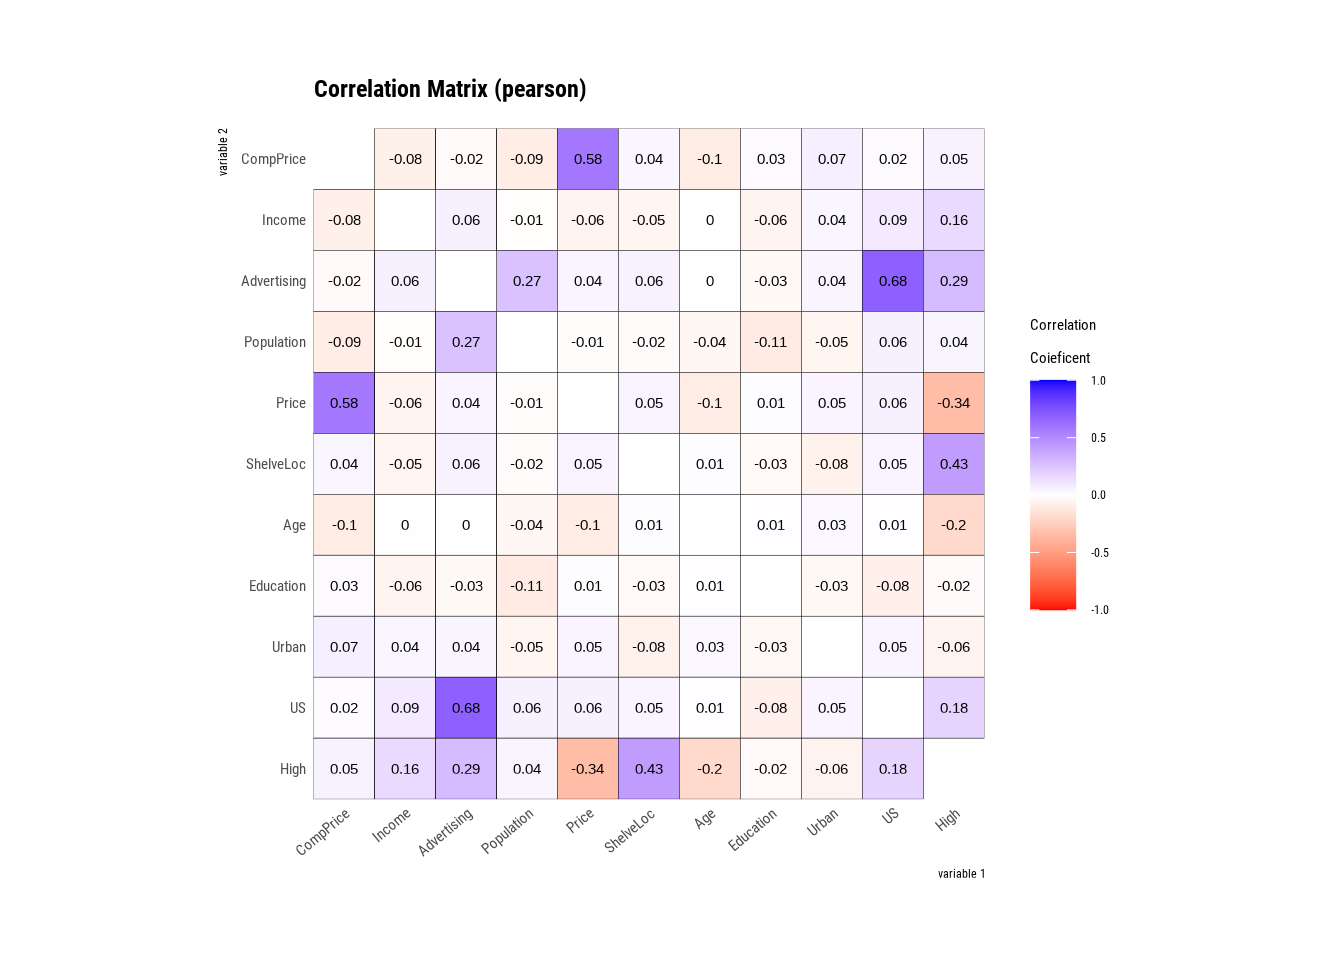
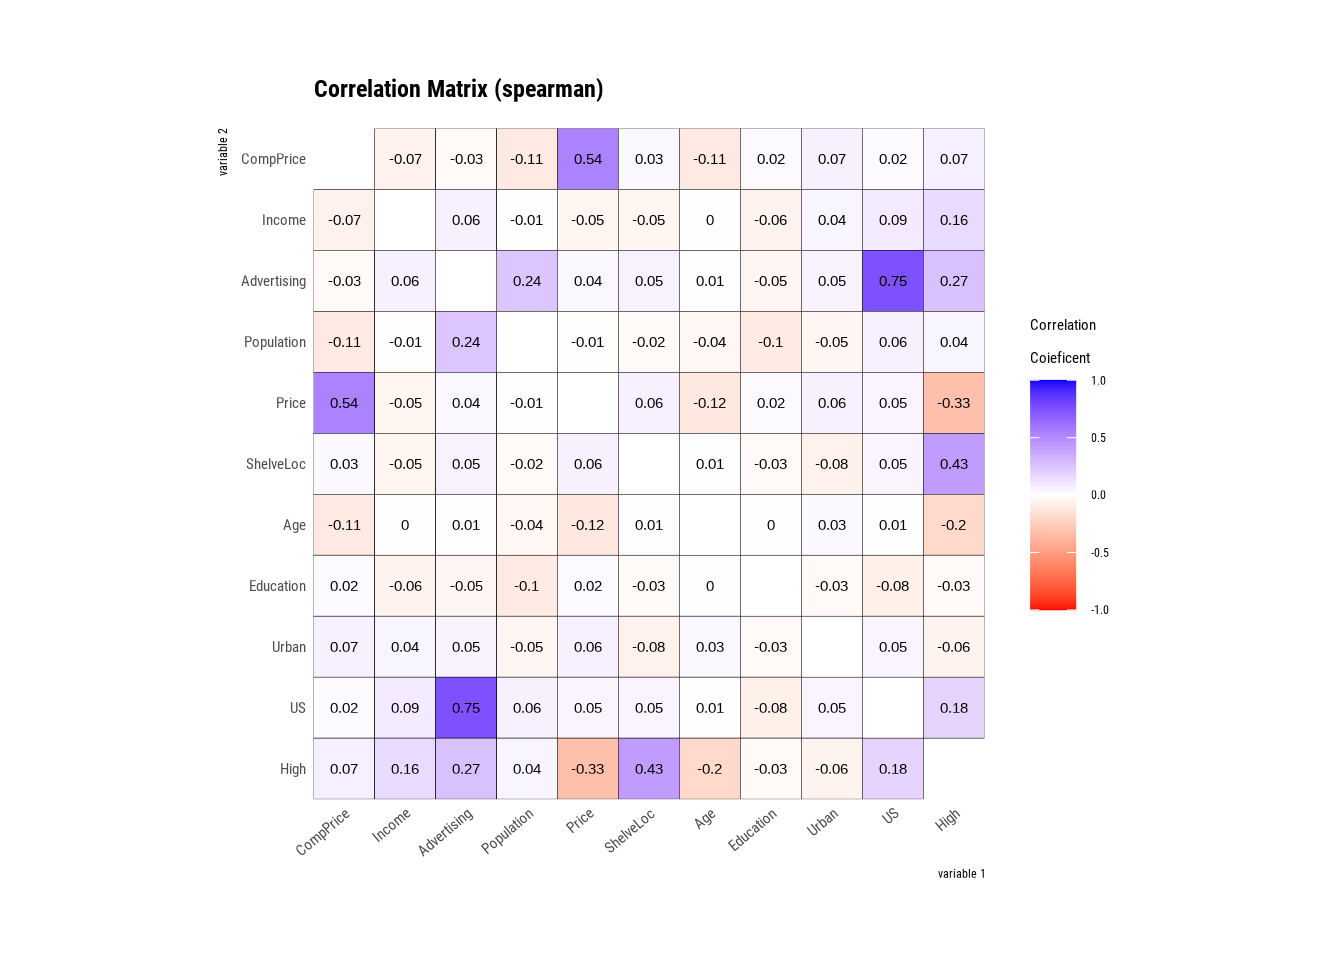
Correlation heatmap (Spearman)
carseats_num %>%
  correlate(method = "spearman") %>%
  plot()