8.50 Evaluate the model
It appears that higher complexity works are to be preferred according to our cross-validation.
autoplot(tune_res)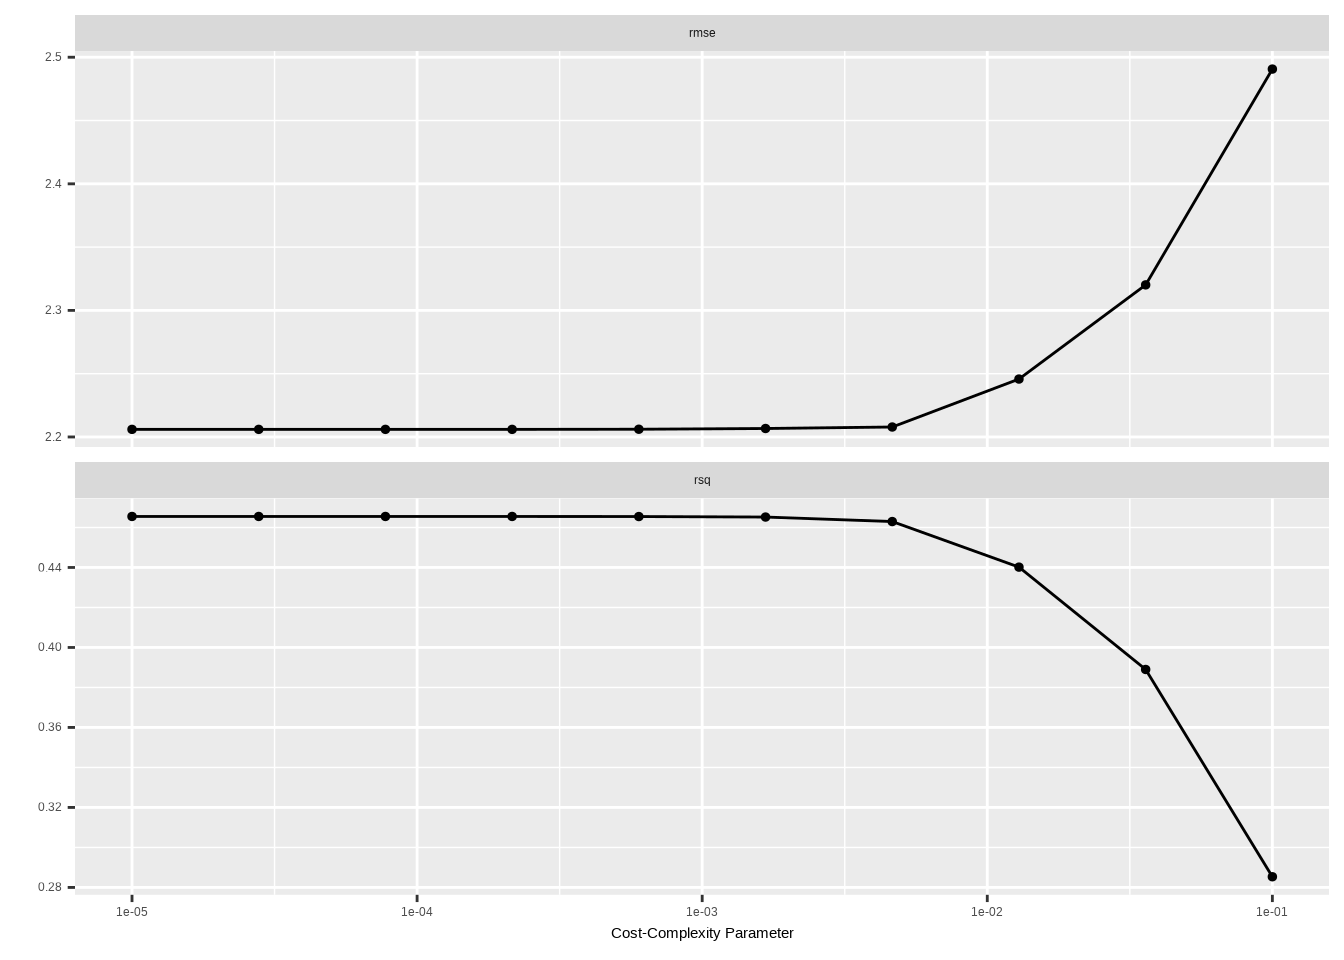
We select the best-performing model according to "rmse" and fit the final model on the whole training data set.
best_complexity <- select_best(tune_res, metric = "rmse")

reg_tree_final <- finalize_workflow(reg_tree_wf, best_complexity)

reg_tree_final_fit <- fit(reg_tree_final, data = carseats_train)
reg_tree_final_fit
## ══ Workflow [trained] ══════════════════════════════════════════════════════════
## Preprocessor: Formula
## Model: decision_tree()
##
## ── Preprocessor ────────────────────────────────────────────────────────────────
## Sales ~ .
##
## ── Model ───────────────────────────────────────────────────────────────────────
## n= 300
##
## node), split, n, deviance, yval
## * denotes terminal node
##
## 1) root 300 2529.534000 7.469333
## 2) ShelveLoc=Bad,Medium 235 1476.666000 6.695702
## 4) Price>=124.5 86 393.091600 5.283721
## 8) CompPrice< 147.5 72 303.087600 4.916528
## 16) Price>=137.5 27 99.462070 3.735556
## 32) Income< 90 20 74.584220 3.207000
## 64) Population< 223.5 9 33.593560 2.347778 *
## 65) Population>=223.5 11 28.910000 3.910000 *
## 33) Income>=90 7 3.326371 5.245714 *
## 17) Price< 137.5 45 143.374700 5.625111
## 34) Advertising< 14.5 38 99.190880 5.249211
## 68) Population>=380 11 11.129290 4.260909 *
## 69) Population< 380 27 72.940210 5.651852
## 138) Age>=43 17 36.912490 5.160588 *
## 139) Age< 43 10 24.950210 6.487000 *
## 35) Advertising>=14.5 7 9.665971 7.665714 *
## 9) CompPrice>=147.5 14 30.370240 7.172143 *
## 5) Price< 124.5 149 813.155300 7.510671
## 10) Age>=50.5 91 411.524700 6.751758
## 20) Price>=86.5 80 283.338300 6.353750
## 40) CompPrice< 123.5 52 157.669400 5.689231
## 80) Price>=102.5 24 52.750780 4.710833
## 160) ShelveLoc=Bad 8 12.693000 3.120000 *
## 161) ShelveLoc=Medium 16 9.688775 5.506250 *
## 81) Price< 102.5 28 62.252070 6.527857
## 162) ShelveLoc=Bad 10 30.689160 5.652000 *
## 163) ShelveLoc=Medium 18 19.629840 7.014444 *
## 41) CompPrice>=123.5 28 60.061870 7.587857
## 82) Advertising< 12.5 21 37.242320 7.114762
## 164) Price>=110 13 14.217510 6.506154 *
## 165) Price< 110 8 10.384790 8.103750 *
## 83) Advertising>=12.5 7 4.018743 9.007143 *
## 21) Price< 86.5 11 23.347450 9.646364 *
## 11) Age< 50.5 58 266.987700 8.701379
## 22) Income< 59.5 18 65.389180 7.101111 *
## 23) Income>=59.5 40 134.760100 9.421500
## 46) Price>=105.5 19 36.968860 8.594211 *
## 47) Price< 105.5 21 73.022200 10.170000
## 94) ShelveLoc=Bad 7 15.859600 8.660000 *
## 95) ShelveLoc=Medium 14 33.221550 10.925000 *
## 3) ShelveLoc=Good 65 403.719500 10.266310
## 6) Price>=109.5 42 197.649800 9.155238
## 12) Price>=142.5 12 36.647220 7.152500 *
## 13) Price< 142.5 30 93.618500 9.956333
## 26) Age>=61.5 9 17.323960 8.537778 *
##
## ...
## and 6 more lines.