12.7 K-means
K-means clustering, we seek to partition the observations into a pre-specified clustering number of clusters.
Steps to K-means:
- decide the number of clusters
- then the K-means algorithm will assign each observation to exactly one of the K clusters
Let C1, . . . , CK denote sets containing the indices of the observations in each cluster
Rule of thumb
A good clustering is one for which the within-cluster variation is as small as possible.
Within-cluster variation measure: \(W(C_k)\)
Minimize \(\sum_{k=1}^KW(C_k)\)
In R we use the kmeans() function. Here is an example with two clusters:
set.seed(2)
x <- matrix(rnorm(50 * 2), ncol = 2)
x[1:25, 1] <- x[1:25, 1] + 3
x[1:25, 2] <- x[1:25, 2] - 4
x_df <-data.frame(x) %>%
mutate(variant=rep(c("A", "B"), each = 25))
ggplot(x_df,aes(X1, X2, color = variant)) +
geom_point()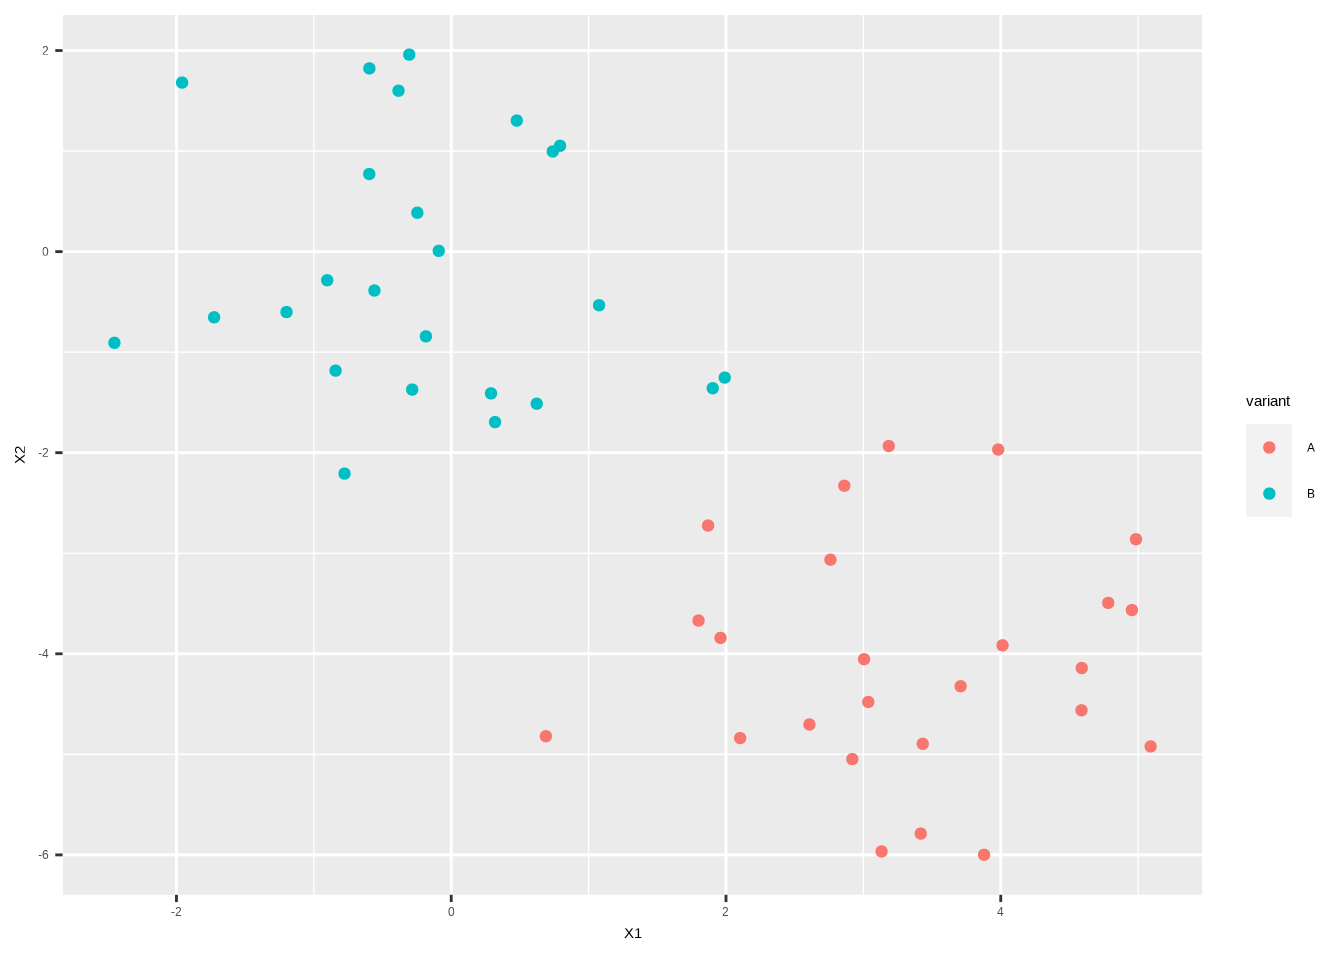
km.out <- kmeans(x, 2, nstart = 20)

broom::tidy(km.out)
## # A tibble: 2 × 5
## x1 x2 size withinss cluster
## <dbl> <dbl> <int> <dbl> <fct>
## 1 3.33 -4.08 25 63.2 1
## 2 -0.196 -0.185 25 65.4 2Functions to use to extrapolate values:
- tidy()
- glance()
- augment()
augment(km.out, data = x_df) %>%
  ggplot(aes(X1, X2, color = .cluster)) +
  geom_point()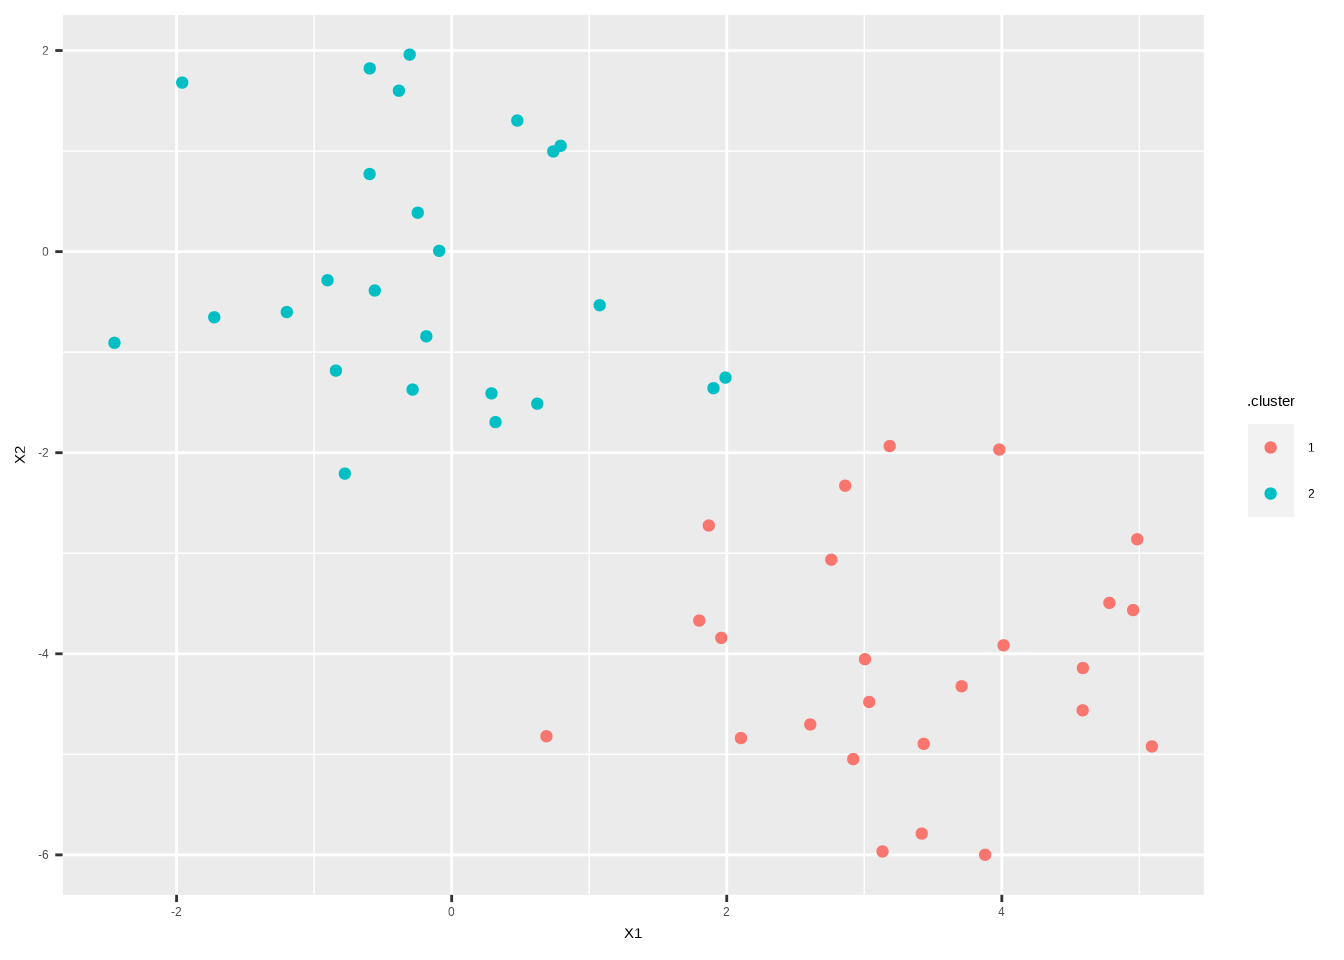
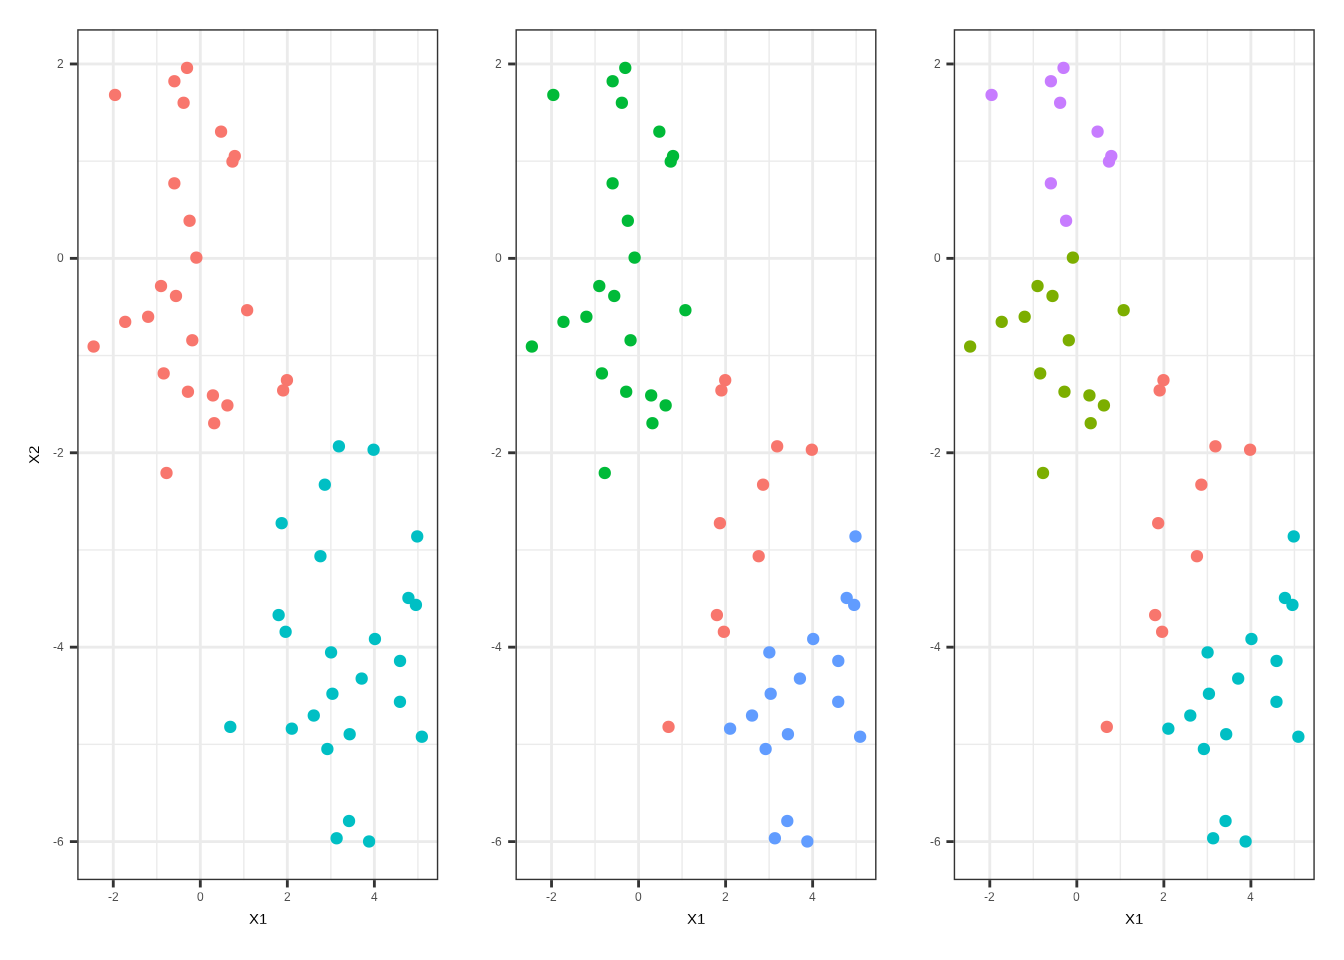
Try different clusters numbers to find the best one grouping.
set.seed(1234)
multi_kmeans <- tibble(k = 1:10) %>%
  mutate(
    model = purrr::map(k, ~ kmeans(x, centers = .x, nstart = 20)),
    tot.withinss = purrr::map_dbl(model, ~ glance(.x)$tot.withinss)
  )

multi_kmeans
## # A tibble: 10 × 3
## k model tot.withinss
## <int> <list> <dbl>
## 1 1 <kmeans> 474.
## 2 2 <kmeans> 129.
## 3 3 <kmeans> 98.0
## 4 4 <kmeans> 69.8
## 5 5 <kmeans> 50.9
## 6 6 <kmeans> 42.5
## 7 7 <kmeans> 34.6
## 8 8 <kmeans> 29.9
## 9 9 <kmeans> 25.9
## 10 10 <kmeans> 22.0multi_kmeans_2 <- multi_kmeans %>%
filter(k>1 & k<=4) %>%
pull(model) %>%
pluck(1)
multi_kmeans_3 <- multi_kmeans %>%
filter(k>1 & k<=4) %>%
pull(model) %>%
pluck(2)
multi_kmeans_4 <- multi_kmeans %>%
filter(k>1 & k<=4) %>%
pull(model) %>%
pluck(3)group1<-augment(multi_kmeans_2, data = x) %>%
ggplot(aes(X1, X2, color = .cluster)) +
geom_point(show.legend = F) +
theme_bw()
group2<-augment(multi_kmeans_3, data = x) %>%
ggplot(aes(X1, X2, color = .cluster)) +
geom_point(show.legend = F) +
labs(y="") +
theme_bw()
group3<-augment(multi_kmeans_4, data = x) %>%
ggplot(aes(X1, X2, color = .cluster)) +
geom_point(show.legend = F) +
labs(y="") +
theme_bw()
library(patchwork)
group1|group2|group3