3.3 Simple Linear Regression: Visualization
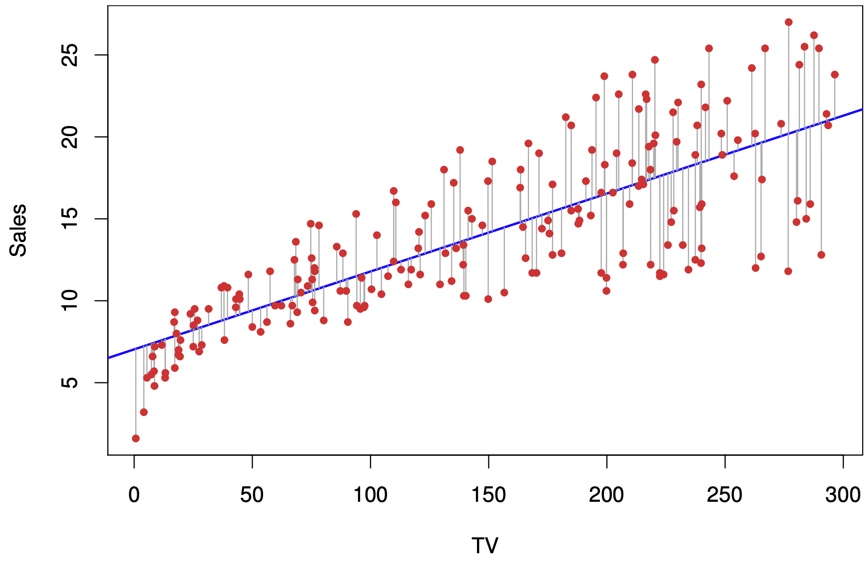
Figure 3.1: For the Advertising data, the least squares fit for the regression of sales onto TV is shown. The fit is found by minimizing the residual sum of squares. Each grey line segment represents a residual. In this case a linear fit captures the essence of the relationship, although it overestimates the trend in the left of the plot.