12.8 Hierarchical clustering
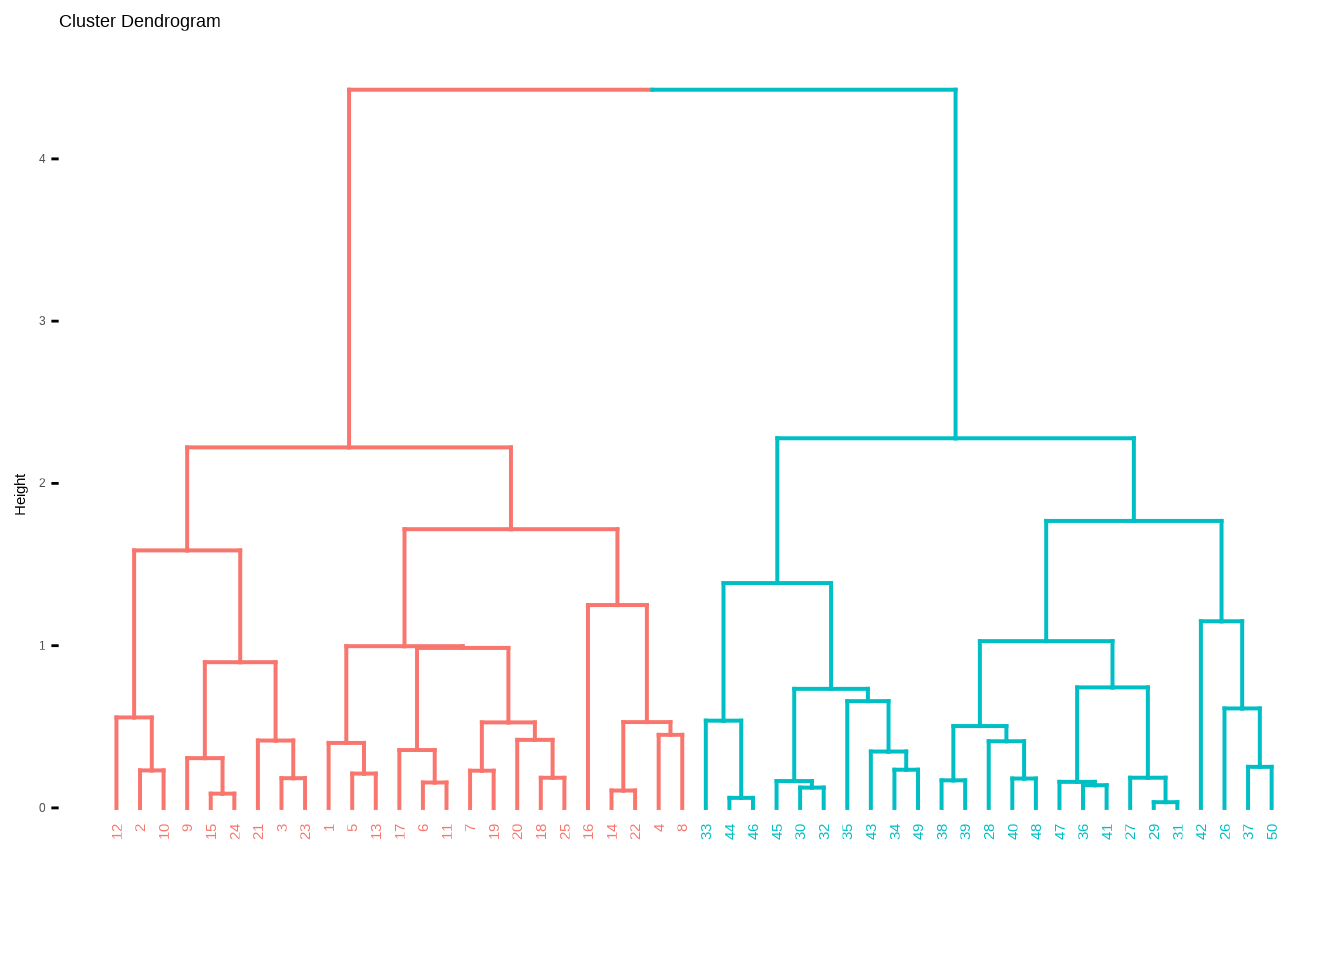
Hierarchical clustering, number of clusters are unknown in advance; usually it is a tree-like visual representation of the observations, called a dendrogram, that allows the understanding of the clusters for each possible number of clusters, from 1 to n.
The algorithm defines some sort of dissimilarity measure between each pair of observations, with the use of Euclidean distance.
12.8.1 Consideration on how to interpret Dendrogram results
In general, there are 2n−1 possible reordering of the dendrogram, where n is the number of leaves, for this reason it is important to keep in mind that the positions of the two fused branches could be swapped without affecting the meaning of the dendrogram, and that it would be incorrect to conclude that two observations are similar on the basis that they are near each other on the dendrogram.
Here we use hclust() function. And define the dissimilarity between two clusters.
What if one or both of the clusters contains multiple observations?
The concept of dissimilarity between a pair of observations needs to be extended to a pair of groups of observations.
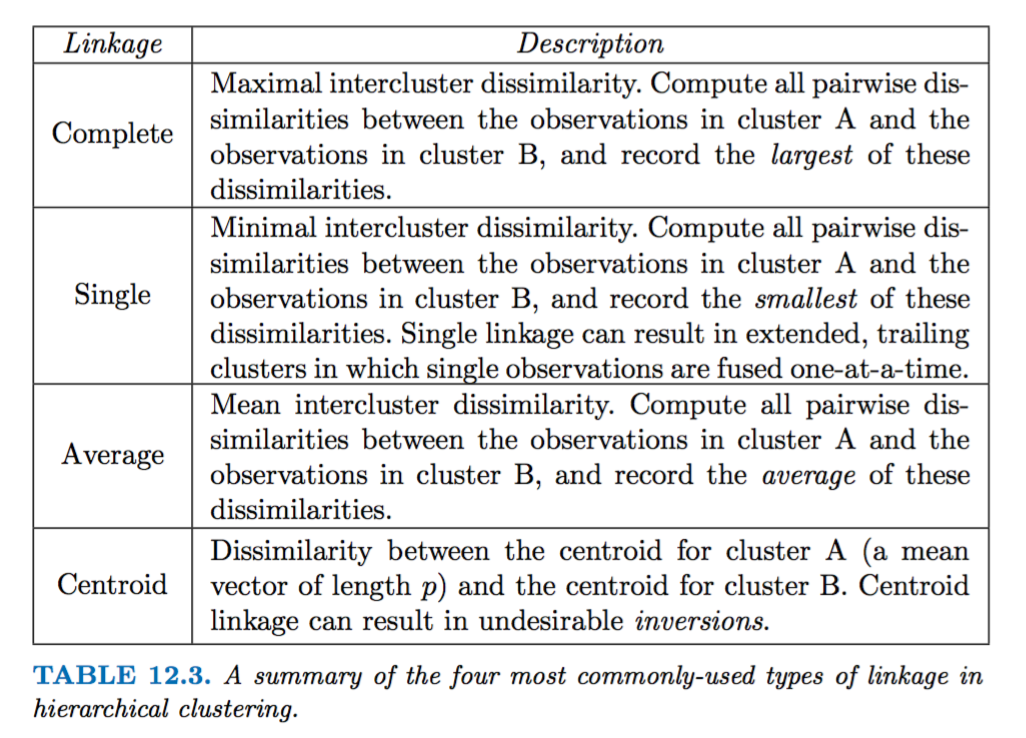
This extension is achieved by developing the notion of linkage, which defines the dissimilarity between two groups of observations.
The four most common types of linkage: complete, average, single, and centroid.
res_hclust_complete <- x %>%
  stats::dist() %>%
  hclust(method = "complete")

res_hclust_average <- x %>%
  stats::dist() %>%
  hclust(method = "average")

res_hclust_single <- x %>%
  stats::dist() %>%
hclust(method = "single")factoextra::fviz_dend(res_hclust_complete, main = "complete", k = 2)## Warning: The `<scale>` argument of `guides()` cannot be `FALSE`. Use "none" instead as
## of ggplot2 3.3.4.
## ℹ The deprecated feature was likely used in the factoextra package.
## Please report the issue at <https://github.com/kassambara/factoextra/issues>.
## This warning is displayed once every 8 hours.
## Call `lifecycle::last_lifecycle_warnings()` to see where this warning was
## generated.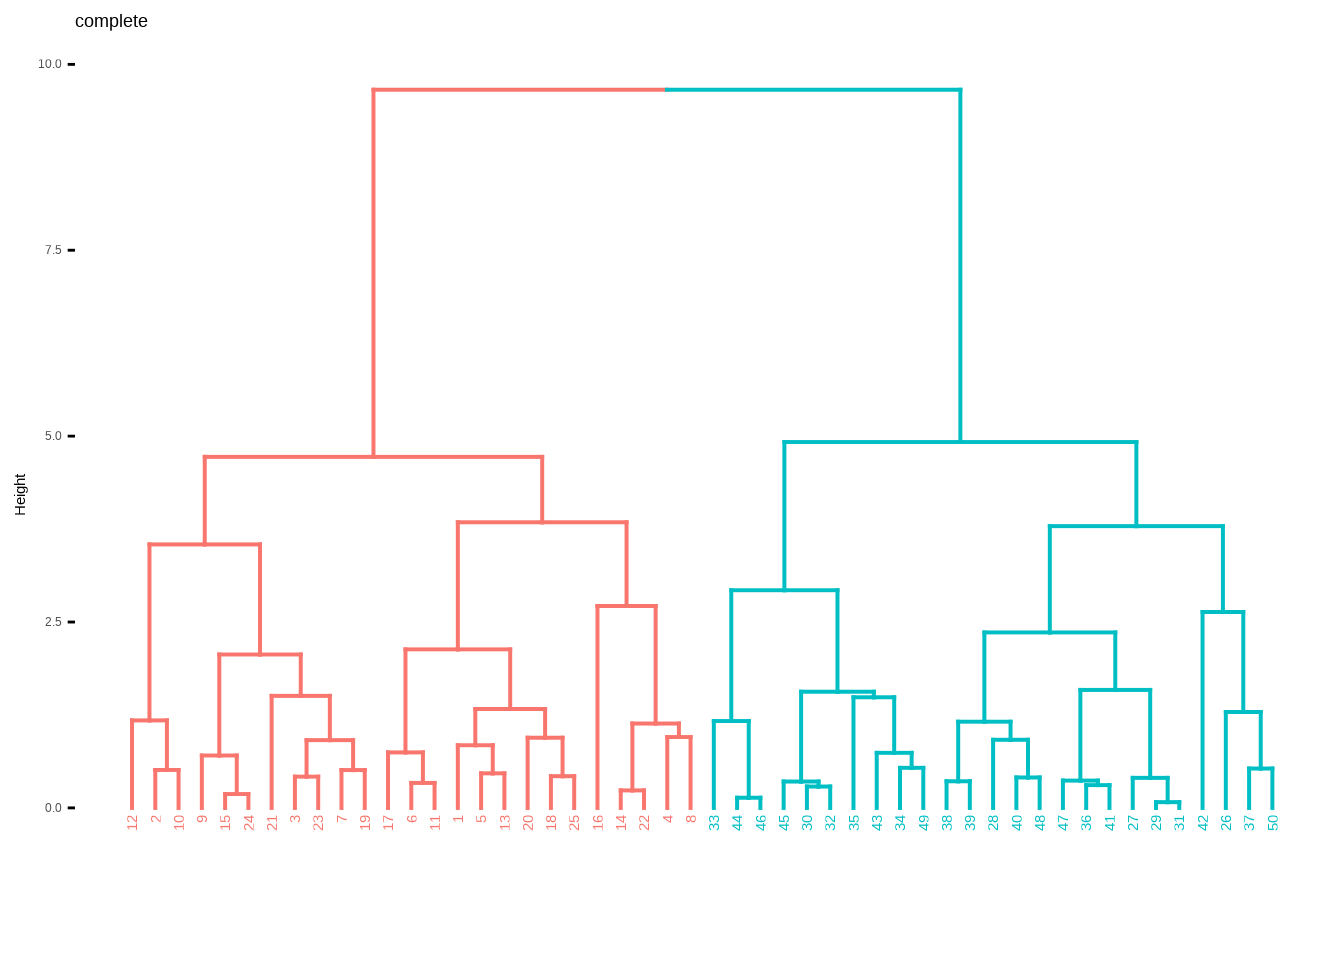
Therefore, we cannot draw conclusions about the similarity of two observations based on their proximity along the horizontal axis. But on their position on the vertical axis.
Hierarchical refers to the fact that clusters, obtained by cutting the dendrogram at a given height, are necessarily nested within the clusters obtained by cutting the dendrogram at any greater height.
factoextra::fviz_dend(res_hclust_average, main = "average", k = 2)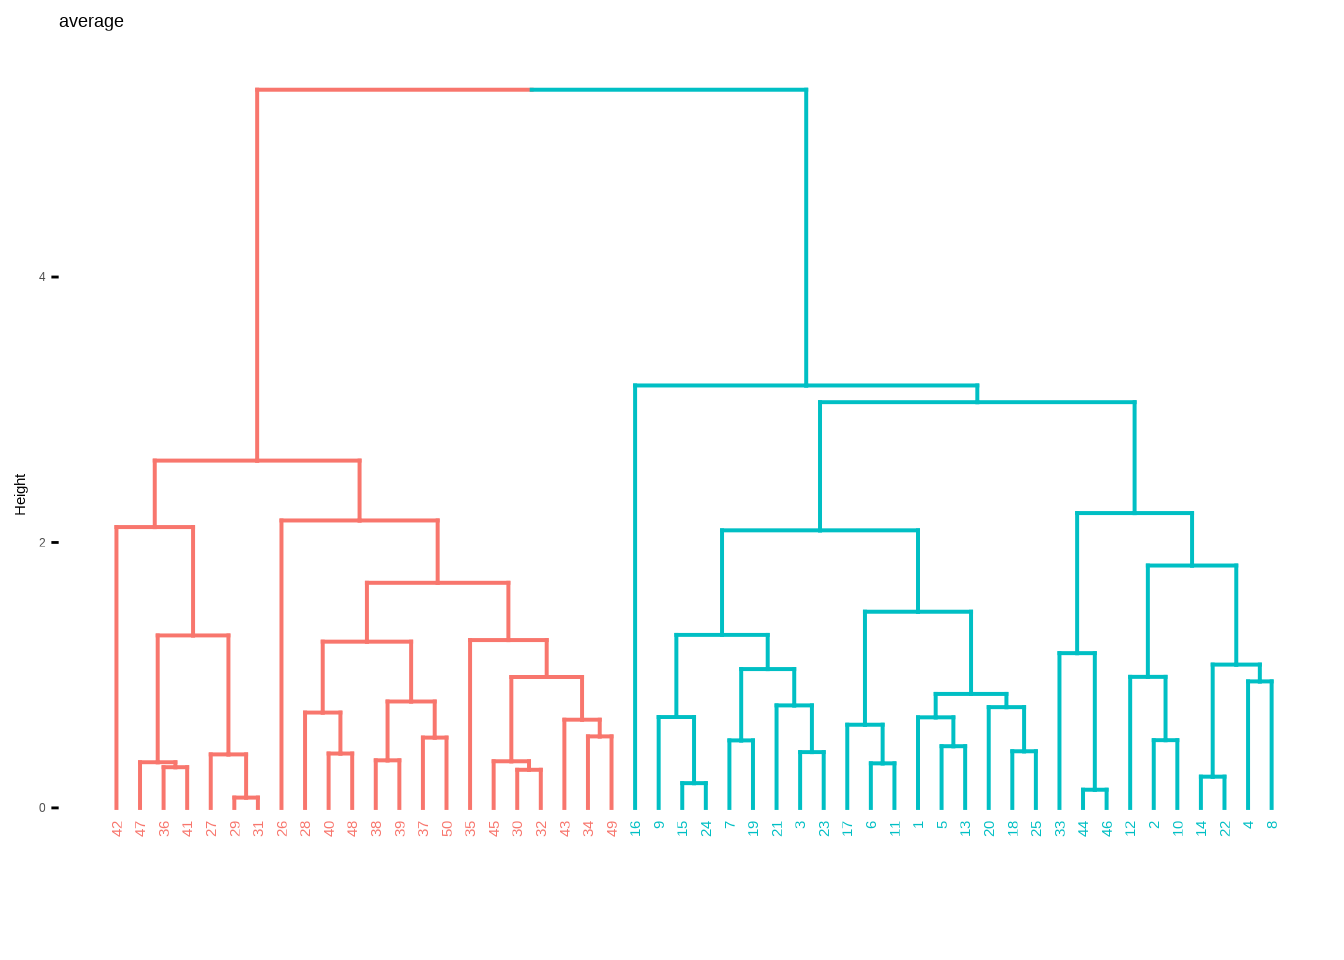
x %>%
  scale() %>%
  stats::dist() %>%
  hclust(method = "complete") %>%
  factoextra::fviz_dend(k = 2)