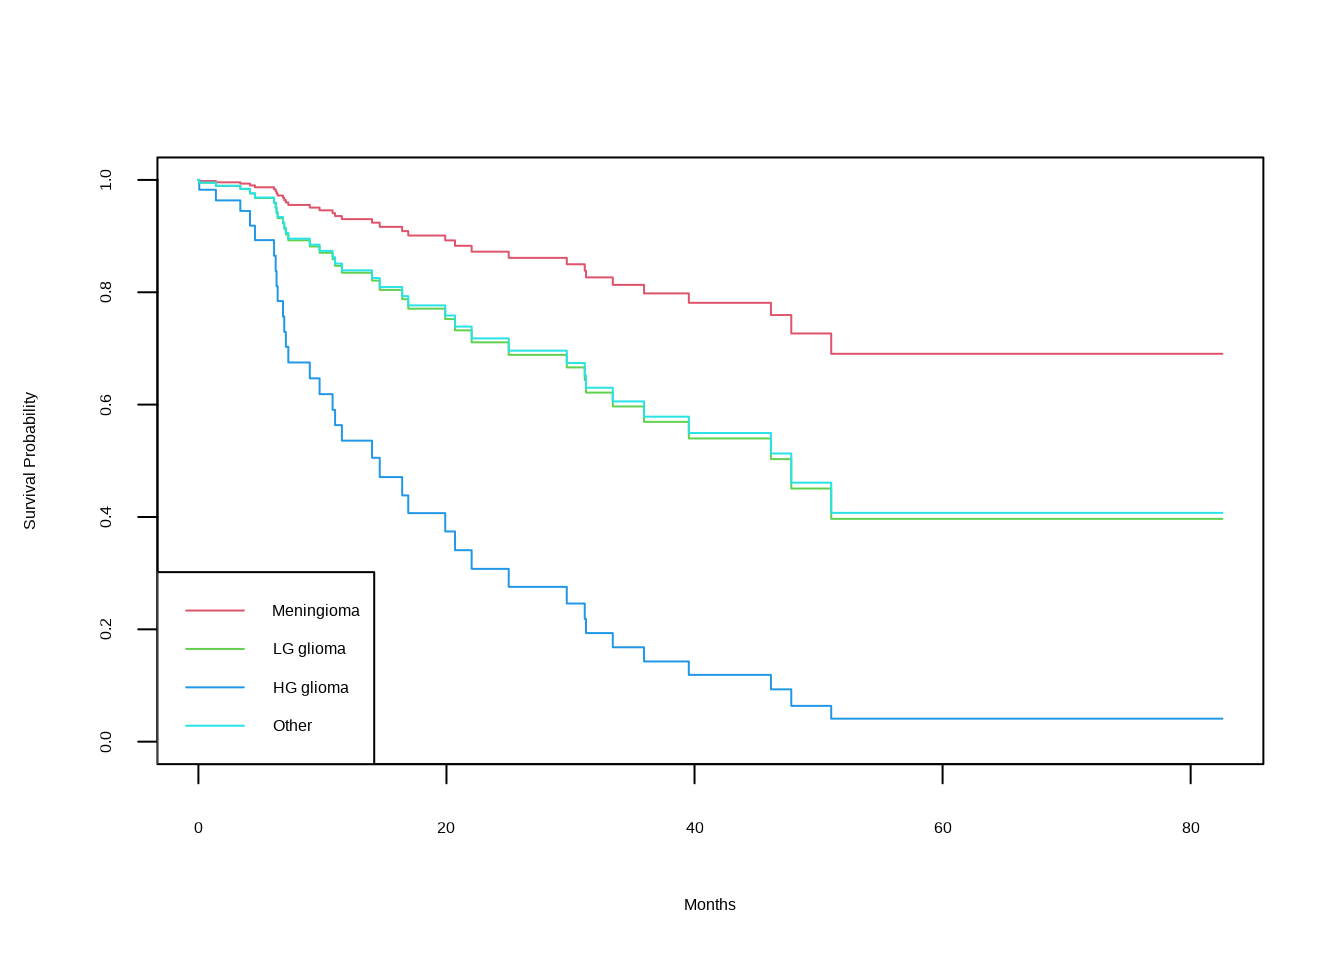
11.15 Surivival Curves
Possible to plot (estimated) survival curves for each diagnosis category, adjusting for the other predictors.
To make these plots, set the values of the other predictors equal to the mean for quantitative variables, and the modal value for factors.
with(BrainCancer,{
  modaldata <- data.frame(
       diagnosis = levels(diagnosis),
       sex = rep("Female", 4),
       loc = rep("Supratentorial", 4),
       ki = rep(mean(ki), 4),
       gtv = rep(mean(gtv), 4),
       stereo = rep("SRT", 4)
       )
  survplots <- survfit(fit.all, newdata = modaldata)
  plot(survplots, xlab = "Months",
      ylab = "Survival Probability", col = 2:5)
  legend("bottomleft", levels(diagnosis), col = 2:5, lty = 1)
})
The book says that the methods used to estimate \(h_0(t)\) are beyond the scope of the book. Documentation for
survfit.coxphmentions a ‘Breslow estimator’ which seems to be similar to Kaplan-Meier… something for future study!