8.18 Variable importance measures
Bagging results in improved accuracy over prediction using a single tree
But, it can be difficult to interpret the resulting model:
we can’t represent the statistical learning procedure using a single tree
it’s not clear which variables are most important to the procedure (i.e., we have many trees each of which may give a differing view on the importance of a given predictor)
So which predictors are important?
An overall summary of the importance of each predictor can be achieved by recording how much the average \(RSS\) or Gini index improves (or decreases) when each tree is split over a given predictor (averaged over all \(B\) trees)
- a large value = important predictor
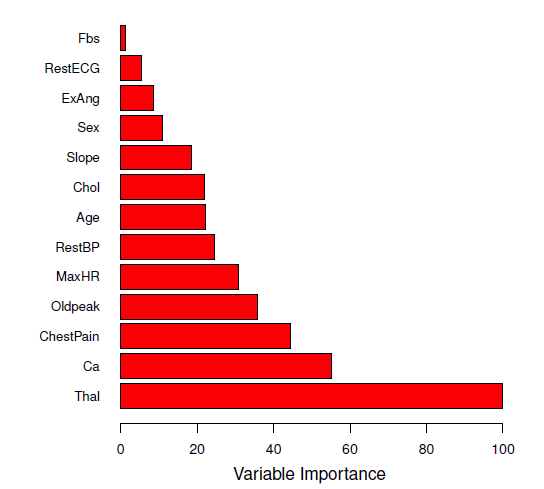
Figure 8.3: A variable importance plot for the Heart data. Variable importance is computed using the mean decrease in Gini index, and expressed relative to the maximum.