11.7 Kaplan-Meier survival curve in R
- K-M curves can be computed using the
survfit()function within theRsurvivallibrary. Heretimecorresponds to \(y_i\), the time to the \(i\)th event (either censoring or death).
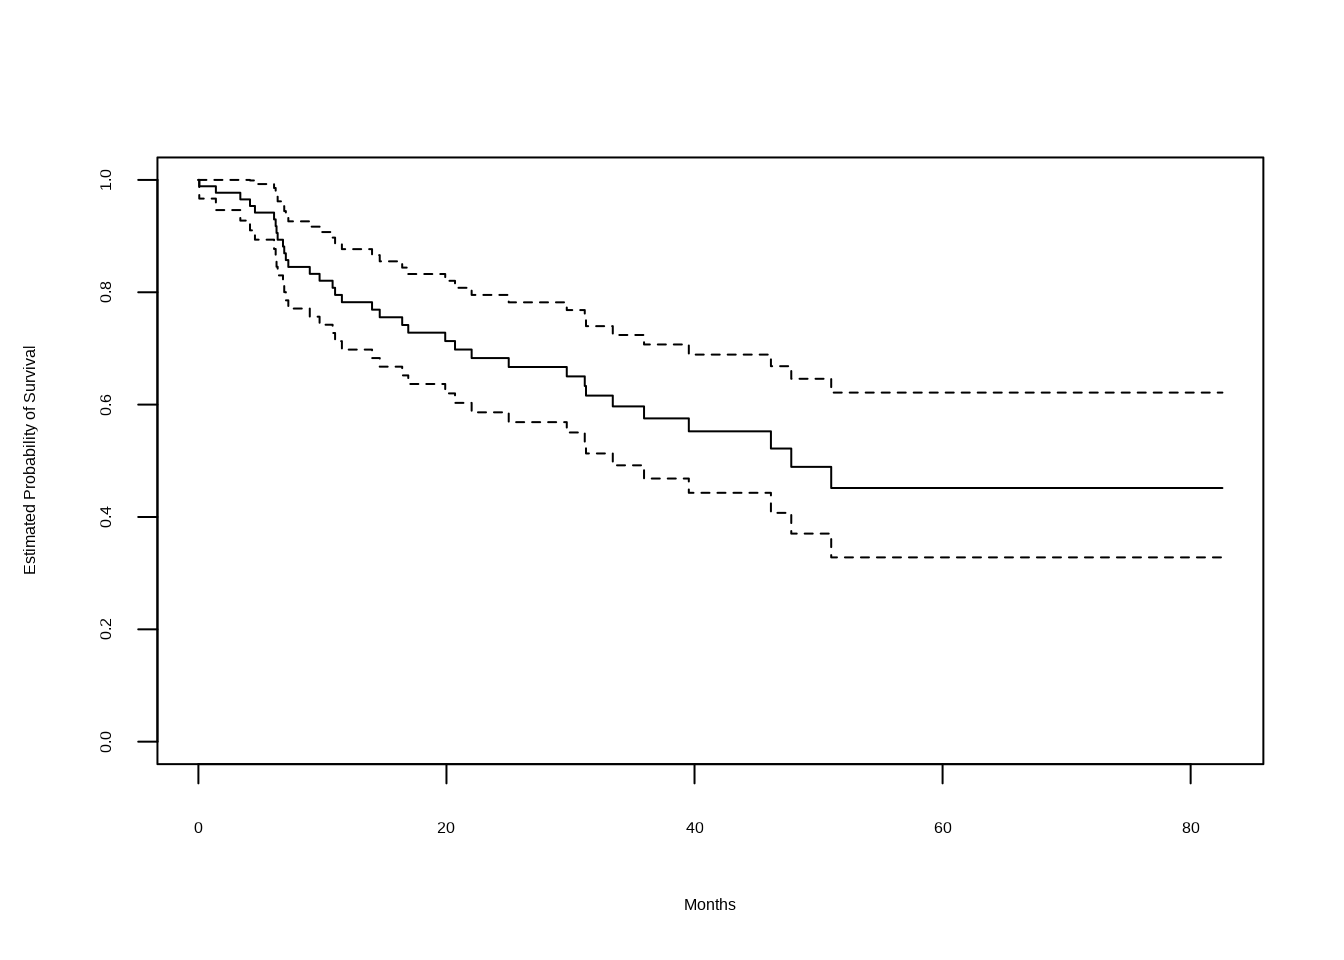
fit.surv <- survfit(Surv(time, status) ~ 1, data = BrainCancer)
plot(fit.surv, xlab = "Months",
    ylab = "Estimated Probability of Survival")