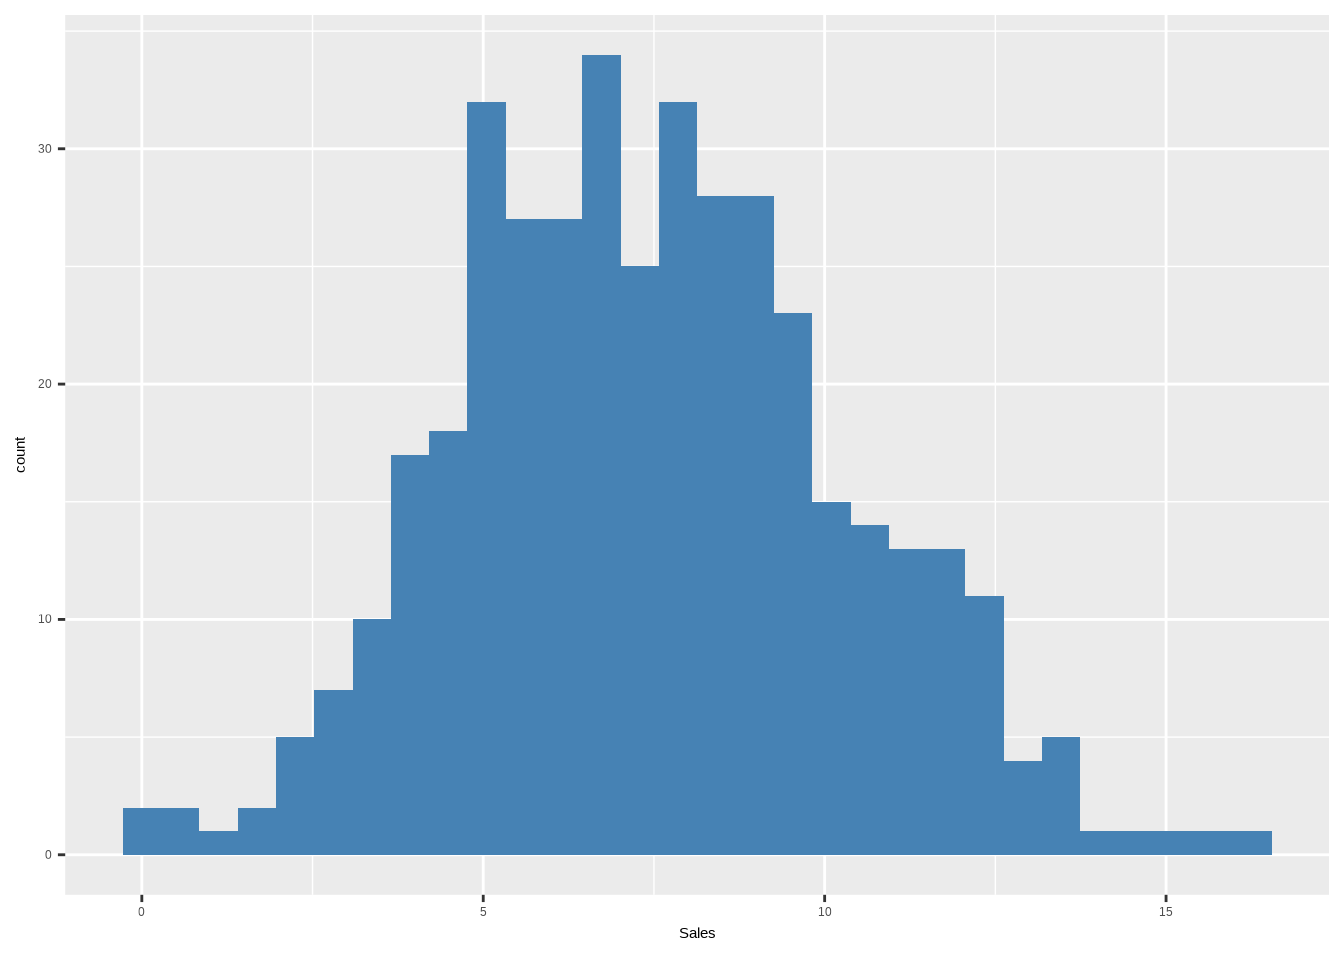
Let’s plot a histogram for Sales (target)
Sales
Carseats %>%
     ggplot(aes(Sales)) +
     geom_histogram(fill = "steelblue")
## `stat_bin()` using `bins = 30`. Pick better value with `binwidth`.