8.21 Example: Random forests versus bagging (gene expression data)
High-dimensional biological data set: contains gene expression measurements of 4,718 genes measured on tissue samples from 349 patients
Each of the patient samples has a qualitative label with 15 different levels: Normal or one of 14 different cancer types
Want to predict cancer type based on the 500 genes that have the largest variance in the training set
Randomly divided the observations into training/test and applied random forests (or bagging) to the training set for 3 different values of \(m\) (the number of predictors available at each split)
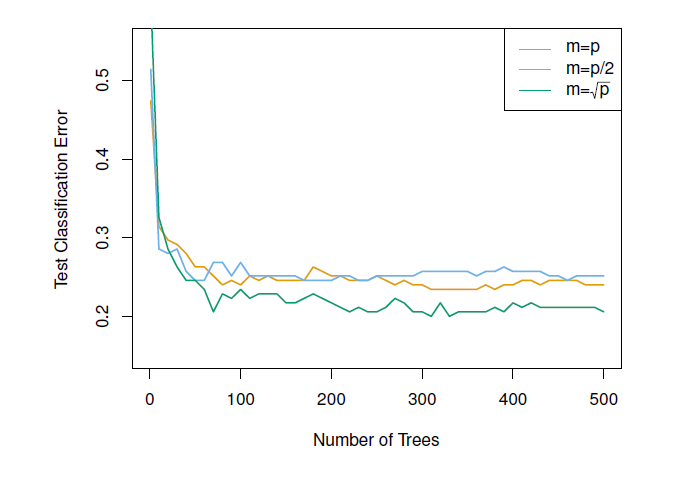
Figure 8.4: Results from random forests for the 15-class gene expression data set with p = 500 predictors. The test error is displayed as a function of the number of trees. Random forests (m < p) lead to a slight improvement over bagging (m = p). A single classification tree has an error rate of 45.7%.