Why Stop There?
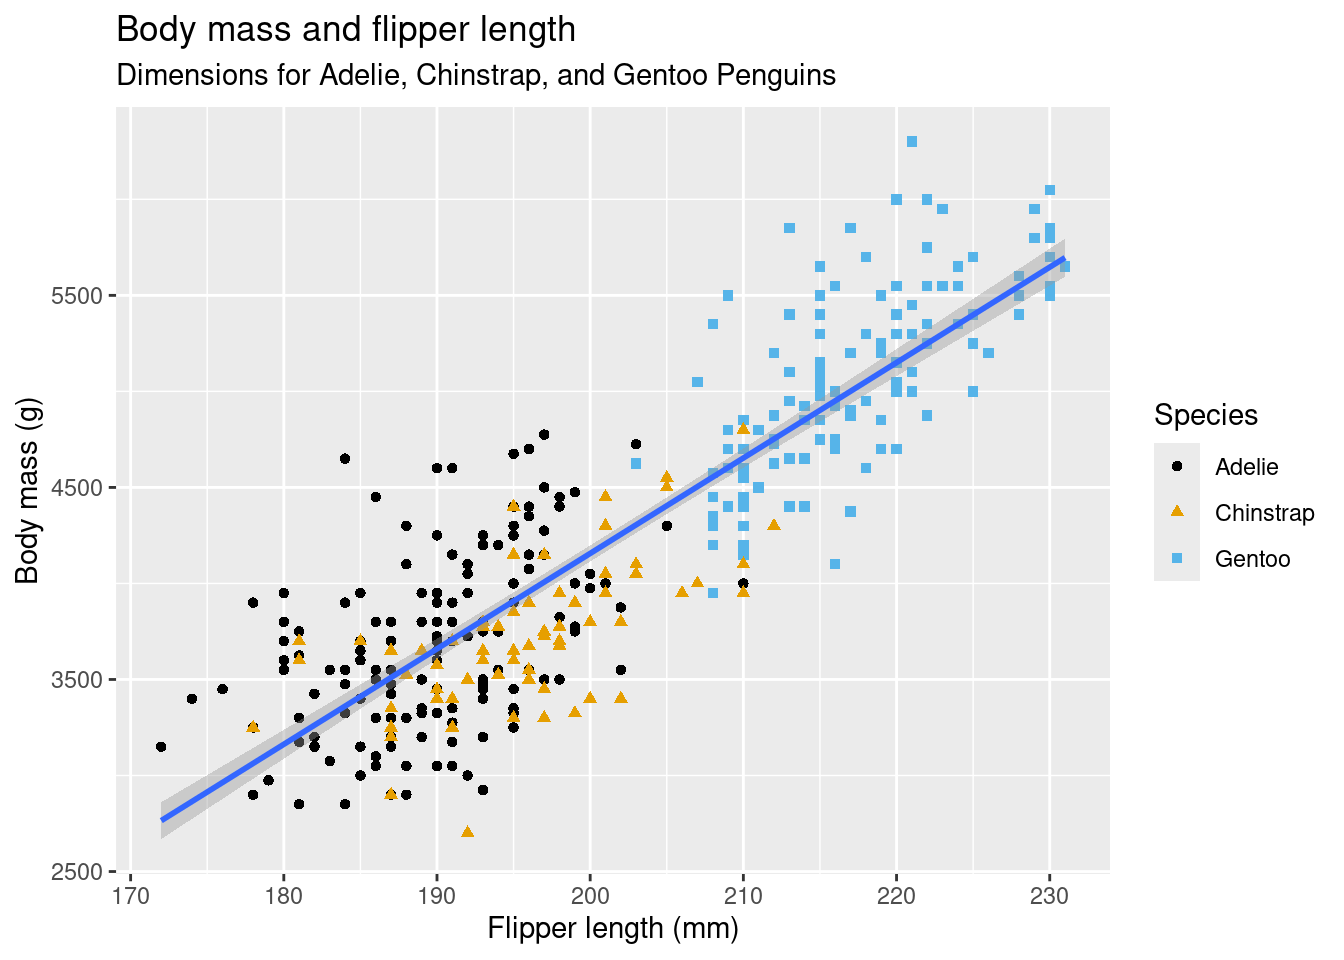
Use labs() to add understandable titles and axes.
ggplot(
  data = penguins,
  mapping = aes(x = flipper_length_mm, y = body_mass_g)
) +
  geom_point(aes(color = species, shape = species)) +
  geom_smooth(method = "lm") +
  labs(
    title = "Body mass and flipper length",
    subtitle = "Dimensions for Adelie, Chinstrap, and Gentoo Penguins",
    x = "Flipper length (mm)", y = "Body mass (g)",
    color = "Species", shape = "Species"
  ) +
  scale_color_colorblind()