Modifying factor order
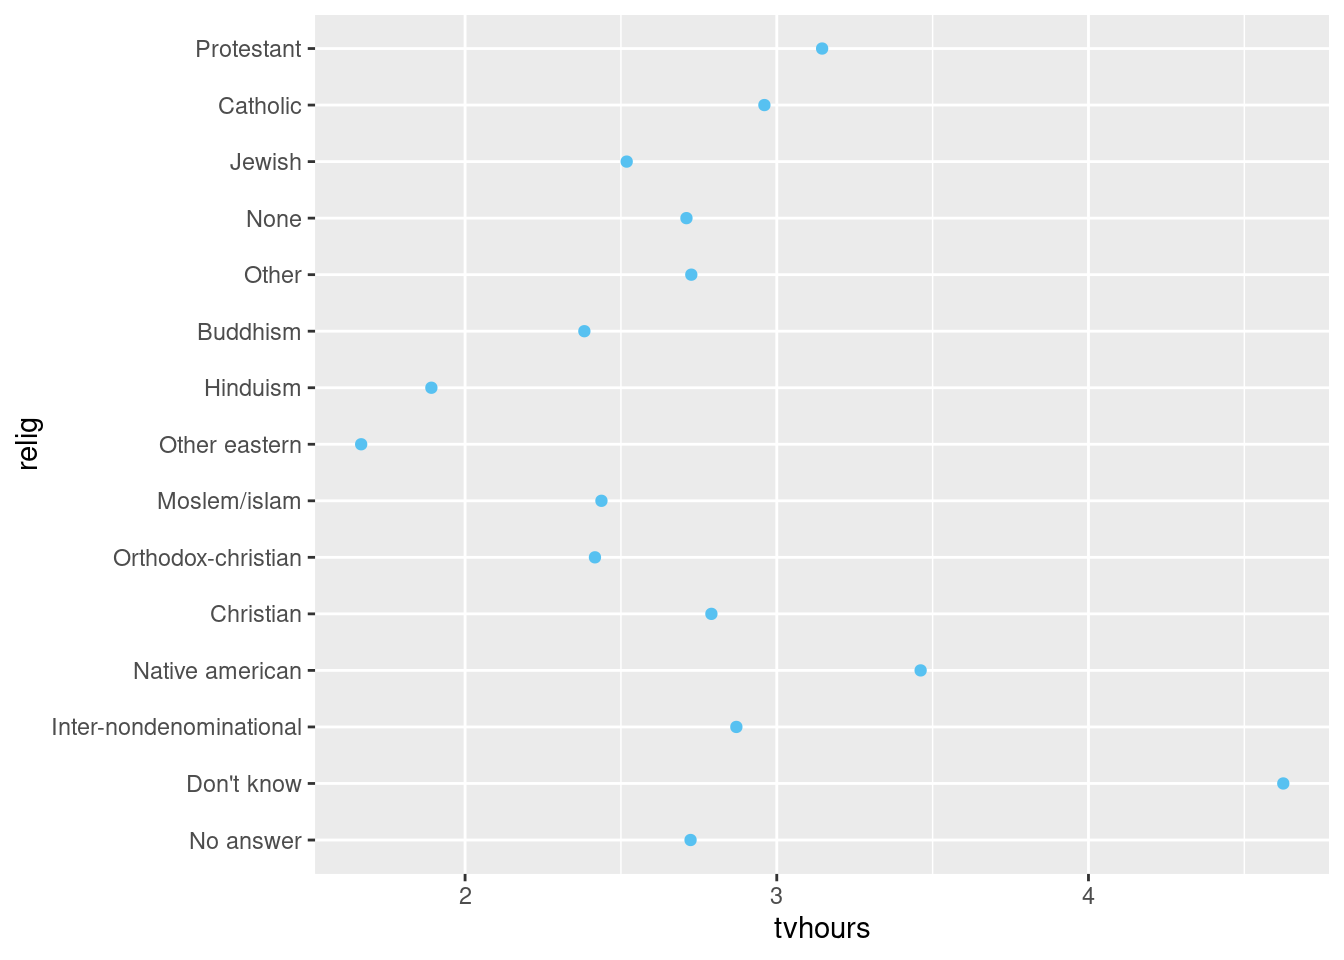
- Let’s look at an example in a plot for which we will modify the order of factors on the y-axis:
relig_summary <- gss_cat |>
  group_by(relig) |>
  summarize(
    age = mean(age, na.rm = TRUE),
    tvhours = mean(tvhours, na.rm = TRUE),
    n = n()
  )

ggplot(relig_summary, aes(x = tvhours, y = relig)) +
  geom_point()