25.15 Adding more variables to plot functions
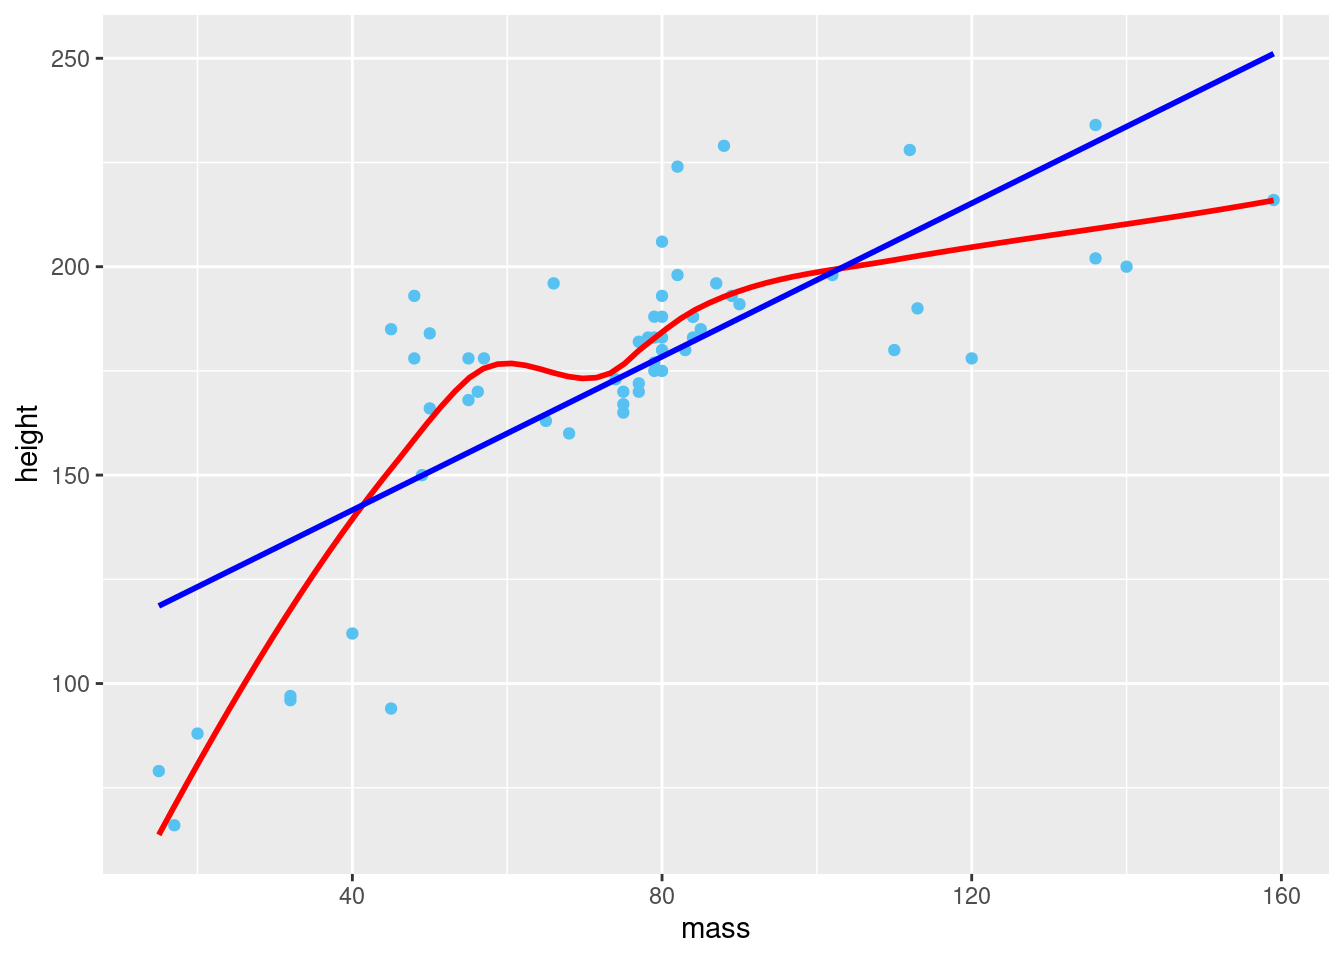
Here, we want an easy way to eyeball whether or not a dataset is linear by overlaying a smooth line and a straight line:
# https://twitter.com/tyler_js_smith/status/1574377116988104704
linearity_check <- function(df, x, y) {
  df |>
    ggplot(aes(x = {{ x }}, y = {{ y }})) +
    geom_point() +
    geom_smooth(method = "loess", formula = y ~ x, color = "red", se = FALSE) +
    geom_smooth(method = "lm", formula = y ~ x, color = "blue", se = FALSE)
}

starwars |>
  filter(mass < 1000) |>
  linearity_check(mass, height)