Change levels of a factor
- Changing the levels of a factor
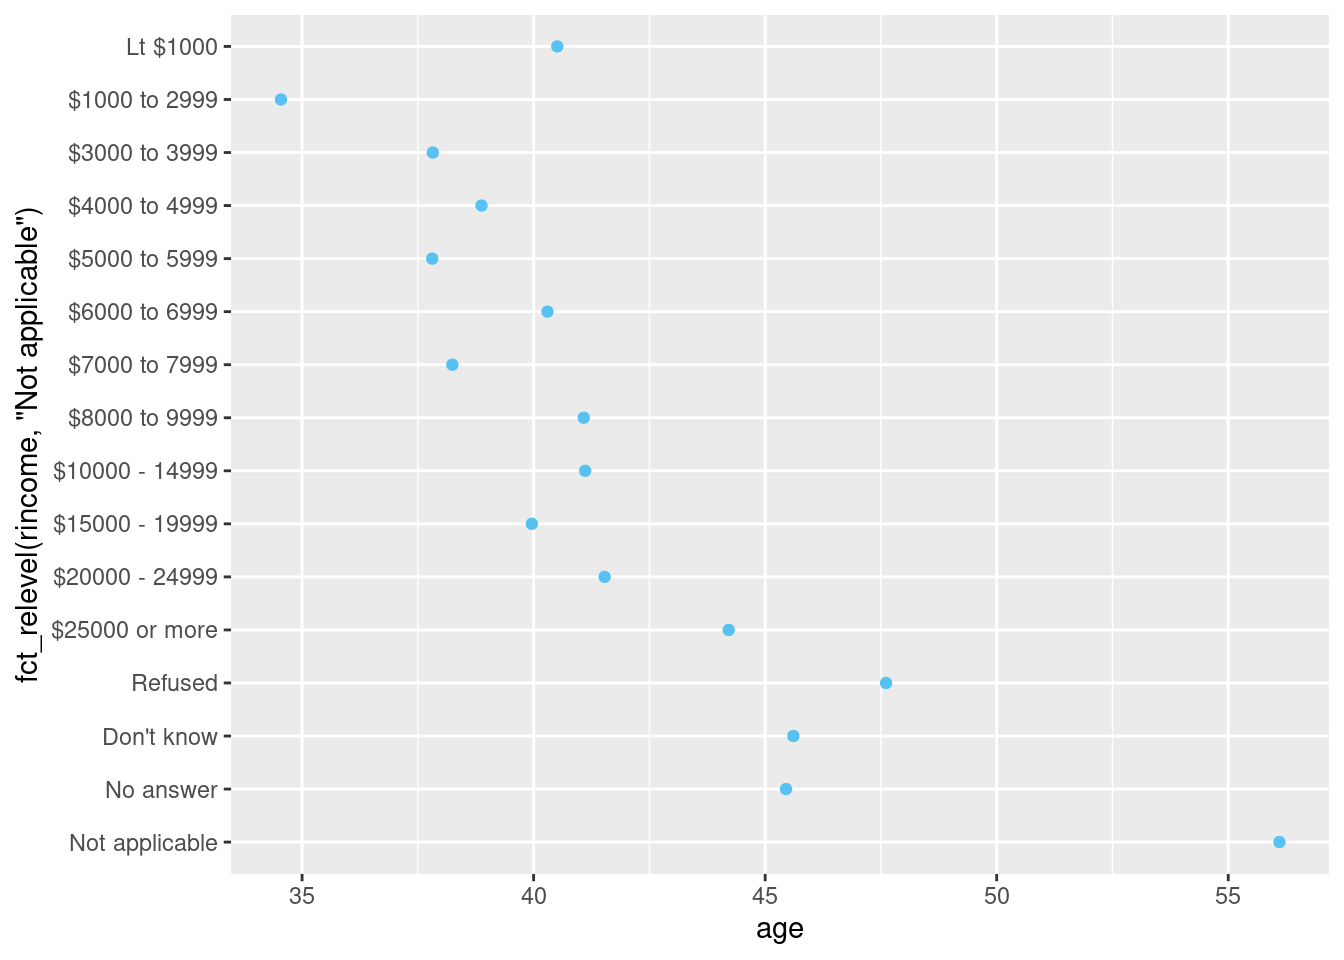
rincome_summary <- gss_cat |>
  group_by(rincome) |>
  summarize(
    age = mean(age, na.rm = TRUE),
    tvhours = mean(tvhours, na.rm = TRUE),
    n = n()
  )


ggplot(rincome_summary,
       aes(x = age,
           y = fct_relevel(rincome,
                           "Not applicable"))) +
  geom_point()
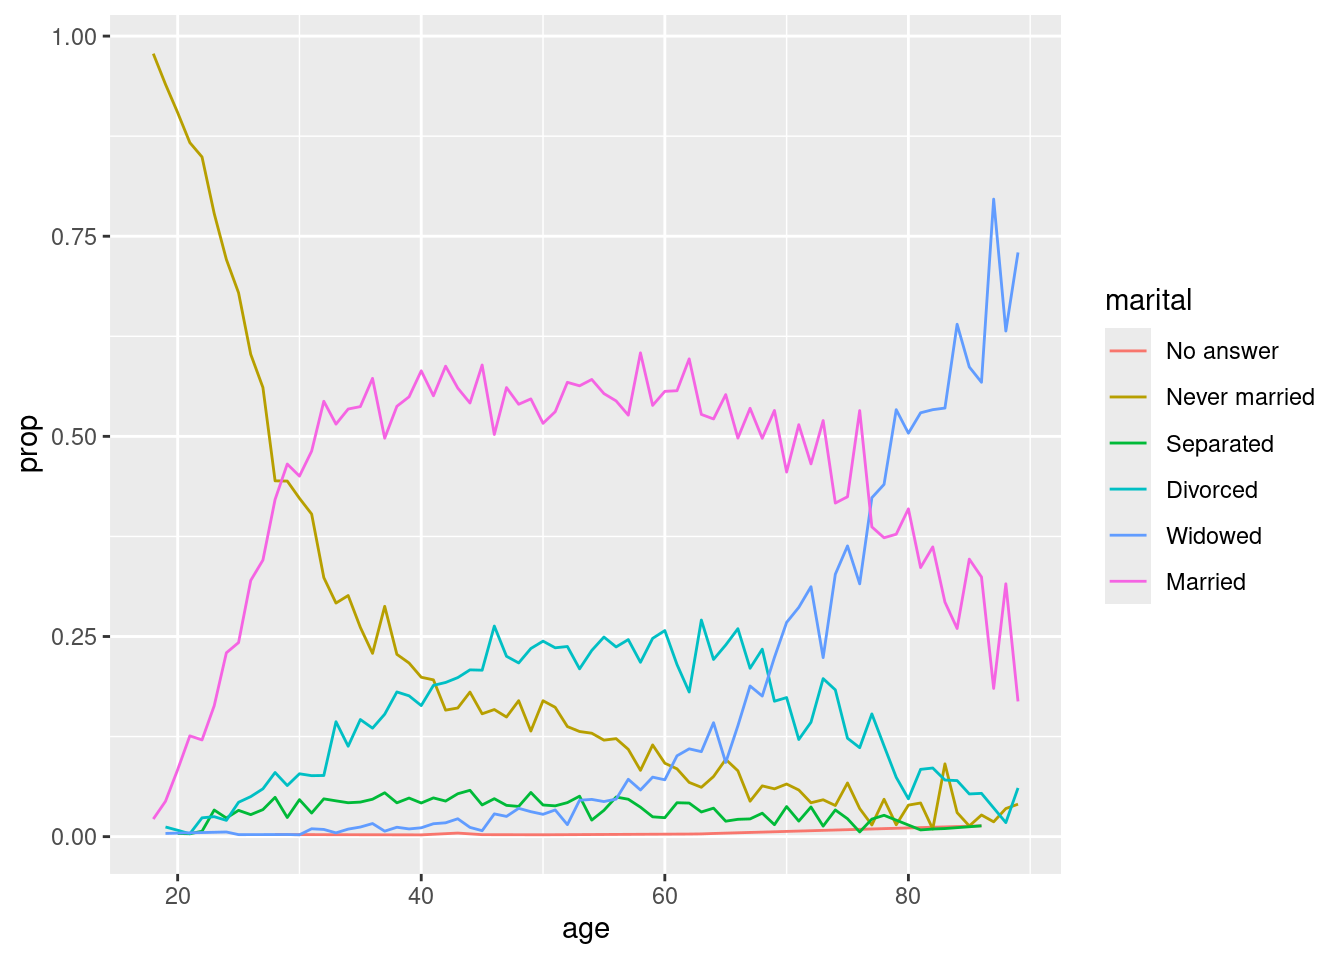
by_age <- gss_cat |>
  filter(!is.na(age)) |>
  count(age, marital) |>
  group_by(age) |>
  mutate(
    prop = n / sum(n)
  )

ggplot(by_age, aes(x = age,
                   y = prop, color = marital)) +
  geom_line(na.rm = TRUE)
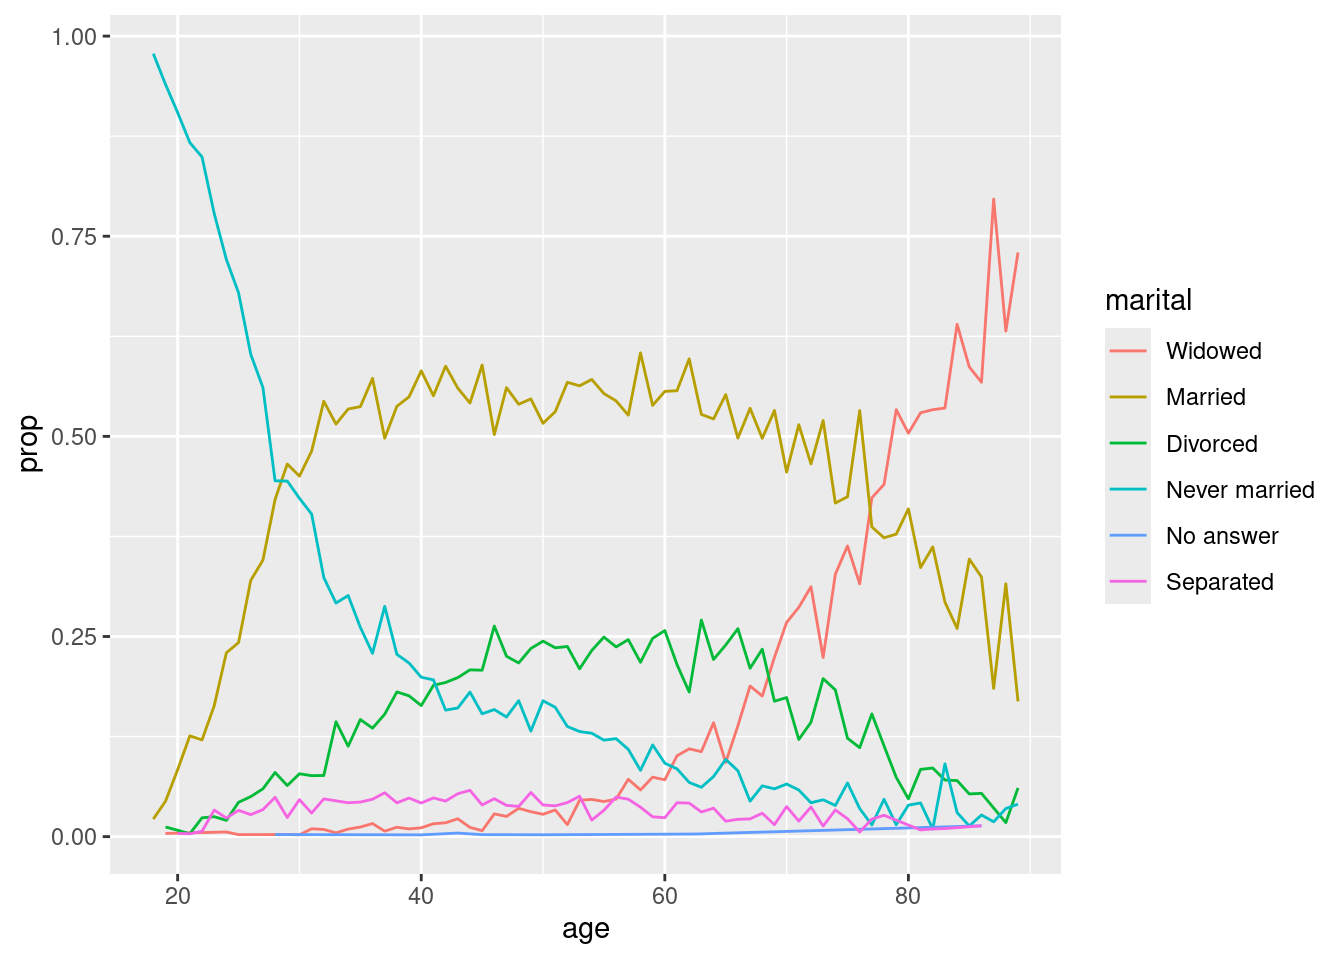
ggplot(by_age, aes(x = age,
                   y = prop,
                   color = fct_reorder2(marital,
                                        age, prop))) +
  geom_line() +
  labs(color = "marital")
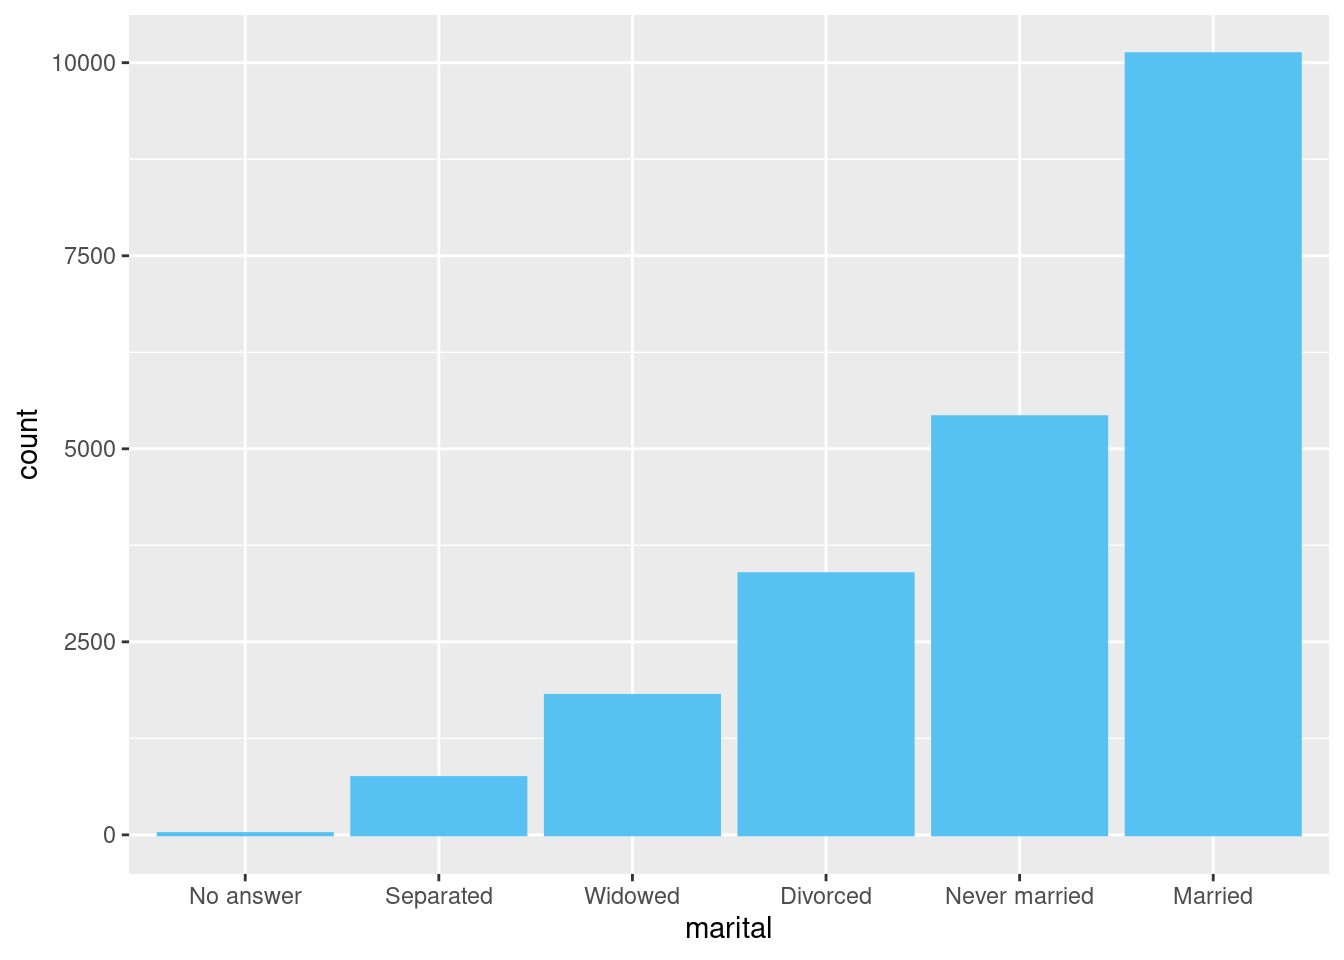
- Changing the order of a bar plot in decreasing frequency with fct_infreq() and in increasing frequency with fct_rev()
gss_cat |>
  mutate(marital = marital |>
           fct_infreq() |>
           fct_rev()) |>
  ggplot(aes(x = marital)) +
  geom_bar()