Adding Layers
- Additional
geom_*()layers may help as well
ggplot(
  data = penguins,
  mapping = aes(x = flipper_length_mm, y = body_mass_g, color = species)
) +
  geom_point() +
  geom_smooth(method = "lm")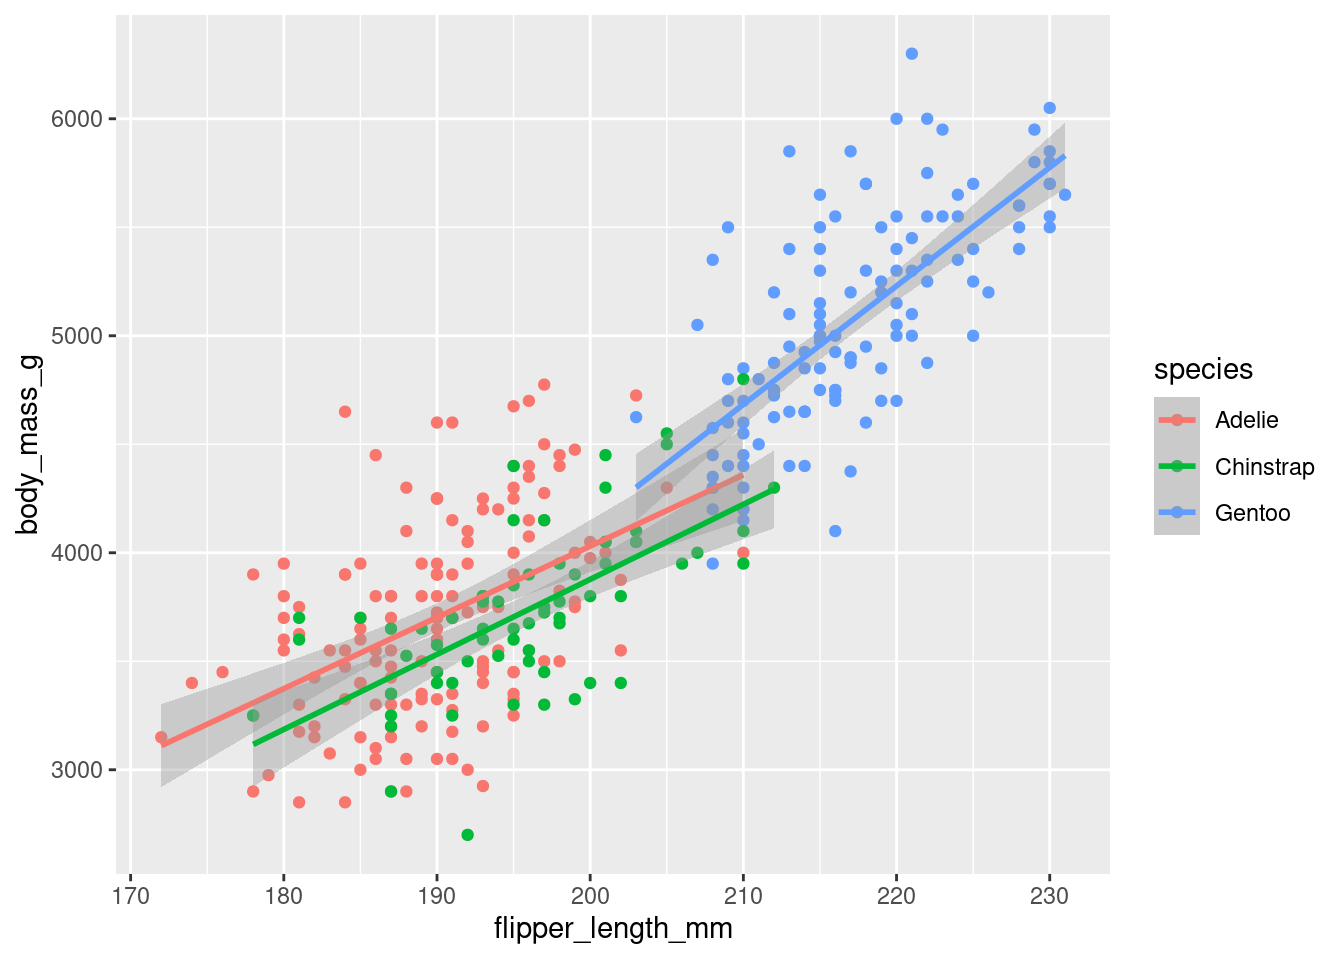
geom_*()functions available:- point (scatterplot)
- line
- smooth (curve)
- histogram / bar or (stat_count) / col
- boxplot
- map
- text / label
- …