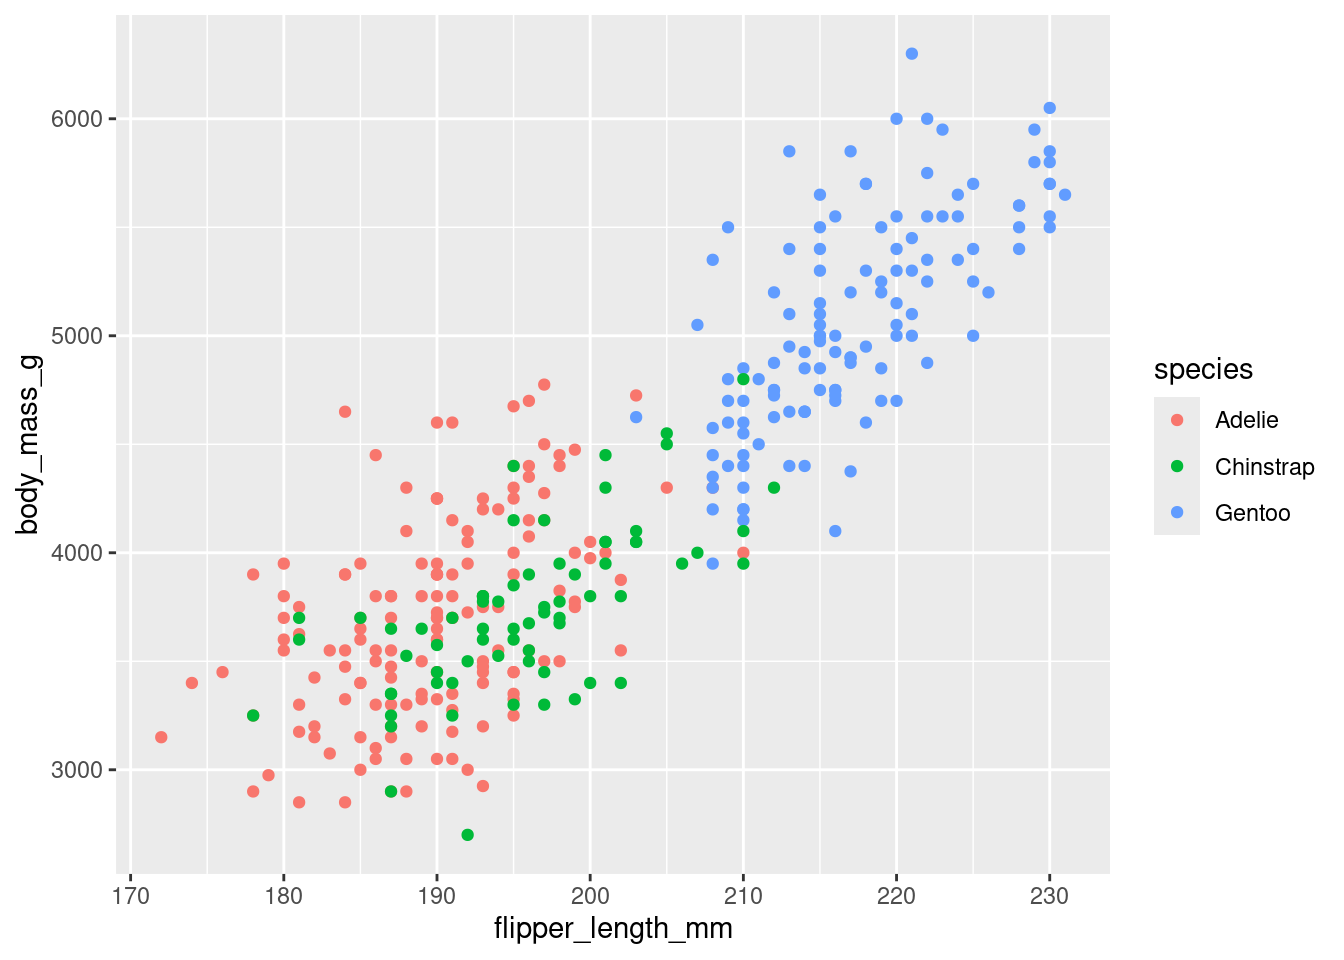
Adding Aesthetics and Layers
- Aesthetics = visual properties of the plot.
- More aesthetics may tell the data’s story better.
- Types of aesthetic mapping:
- coordinates: x and y
- linewidth
- shape
- color
- fill
- alpha (transparency)
- stroke
- linetype
- group
- show.legend
- others, sometimes specific to geom
ggplot(
  data = penguins,
  mapping = aes(
    x = flipper_length_mm,
    y = body_mass_g,
    color = species
  )
) +
  geom_point()