Let’s re order the factos with fct_reorder()
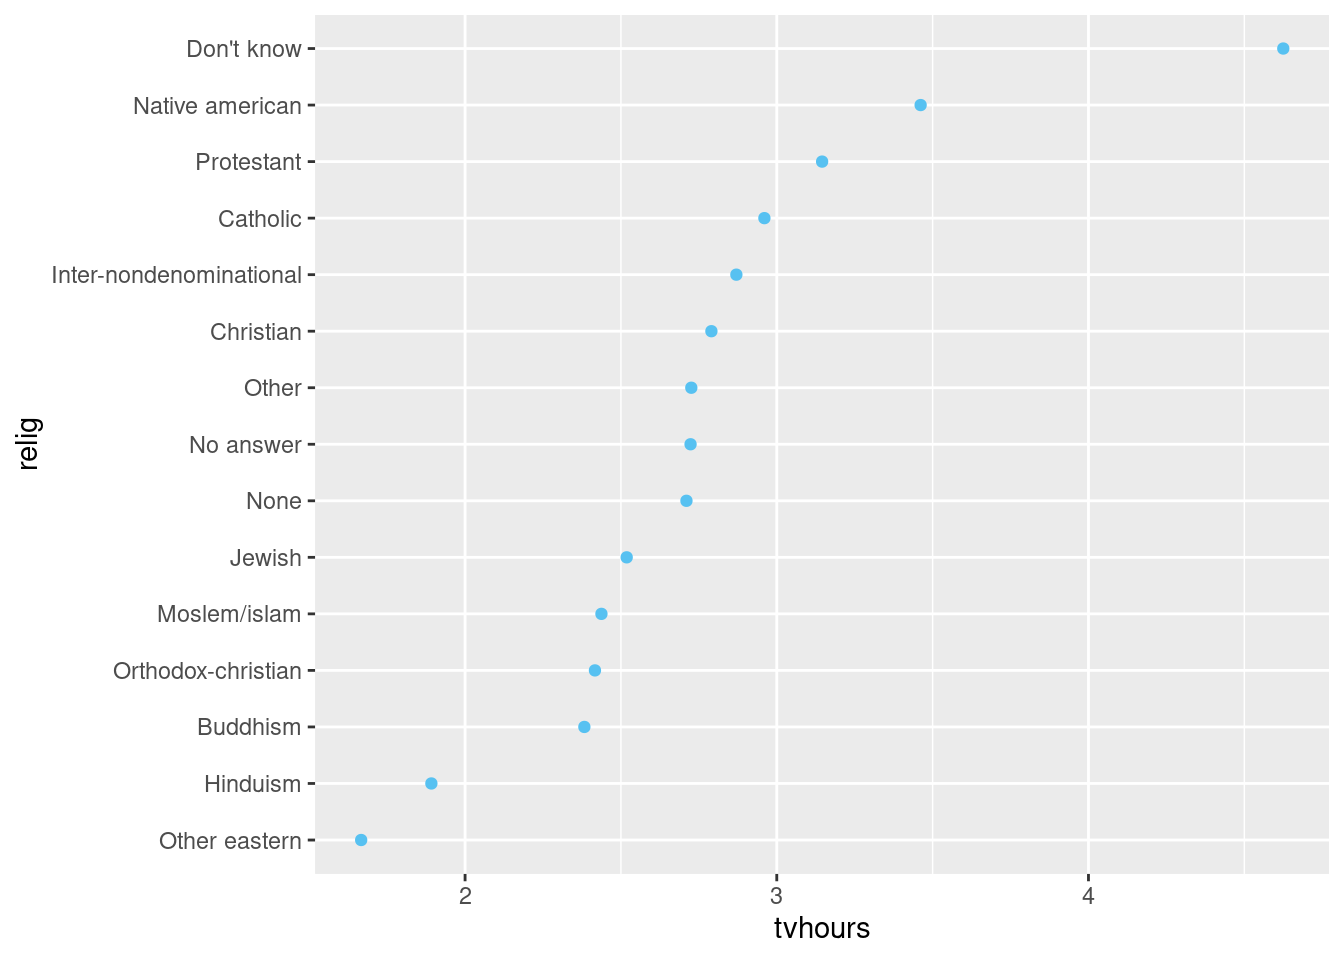
It is hard to read this plot because there’s no overall pattern. We can improve it by reordering the levels of relig using fct_reorder(). fct_reorder() takes three arguments:
f, the factor whose levels you want to modify.
x, a numeric vector that you want to use to reorder the levels.
Optionally, fun, a function that’s used if there are multiple values of x for each value of f. The default value is median.
relig_summary |>
  mutate(
    relig = fct_reorder(relig, tvhours)
  ) |>
  ggplot(aes(x = tvhours, y = relig)) +
  geom_point()