11.3 Scales
The scale_<functions> are very useful in many ways, among which is to set a color/fill scale for a particular plot, or to make modification of the x/y text axis.
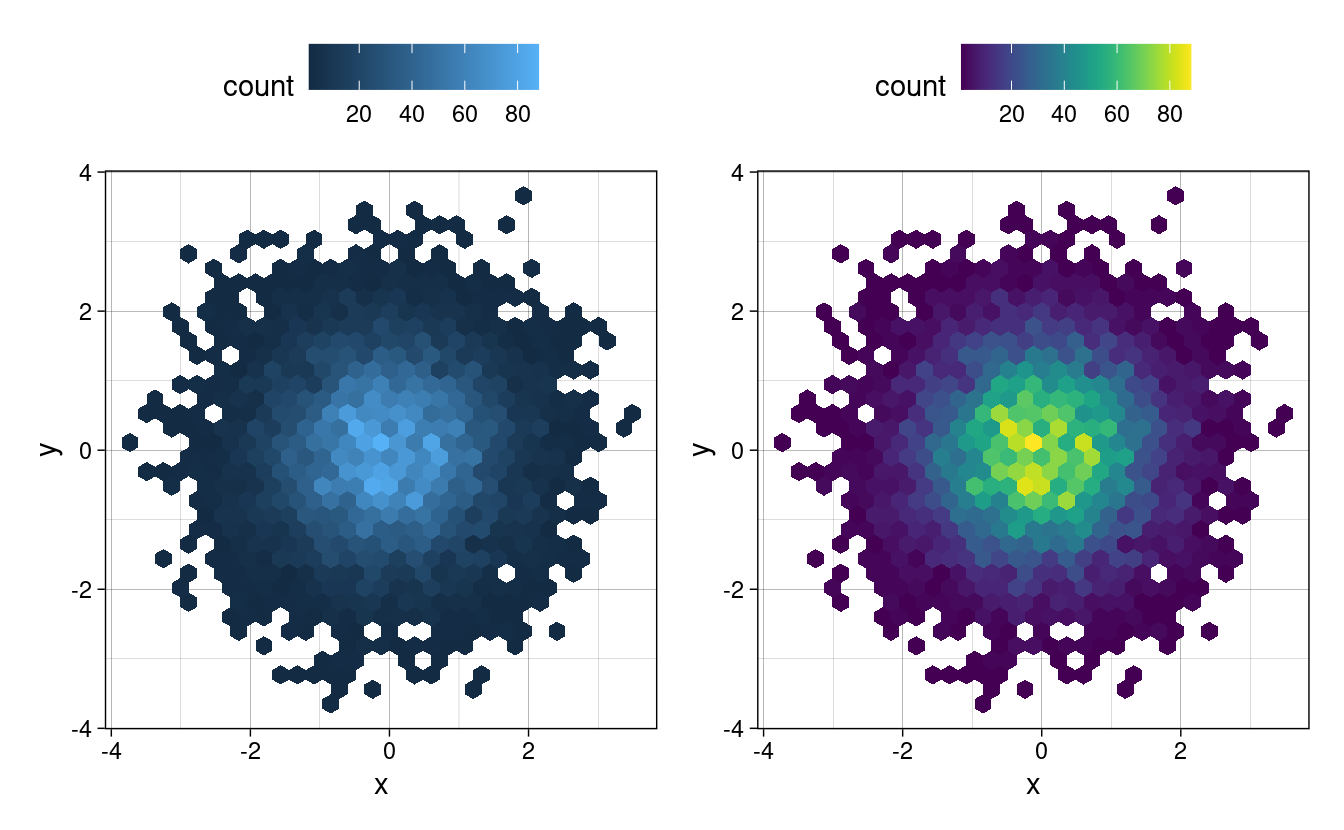
Here the dataset is made of random normal of 10 000 values.
df <- tibble(
  x = rnorm(10000),
  y = rnorm(10000)
)

p1 <- ggplot(df, aes(x, y)) +
  geom_hex() +
  coord_fixed()

p2 <- ggplot(df, aes(x, y)) +
  geom_hex() +
  viridis::scale_fill_viridis() +
  coord_fixed()

library(patchwork)
p1+p2 &
  theme_linedraw() &
  theme(legend.position = "top")