palmerpenguins
ggplot2
names
values
readr::read_csv
janitor
skip = n
comment = "#"
col_names = FALSE
col_names
col_types
problems()
NA
\
fct_reorder()
dplyr::antijoin
forcats 1.0.0
join_by()
rescale01()
across()
[
[[
$
apply()
for()
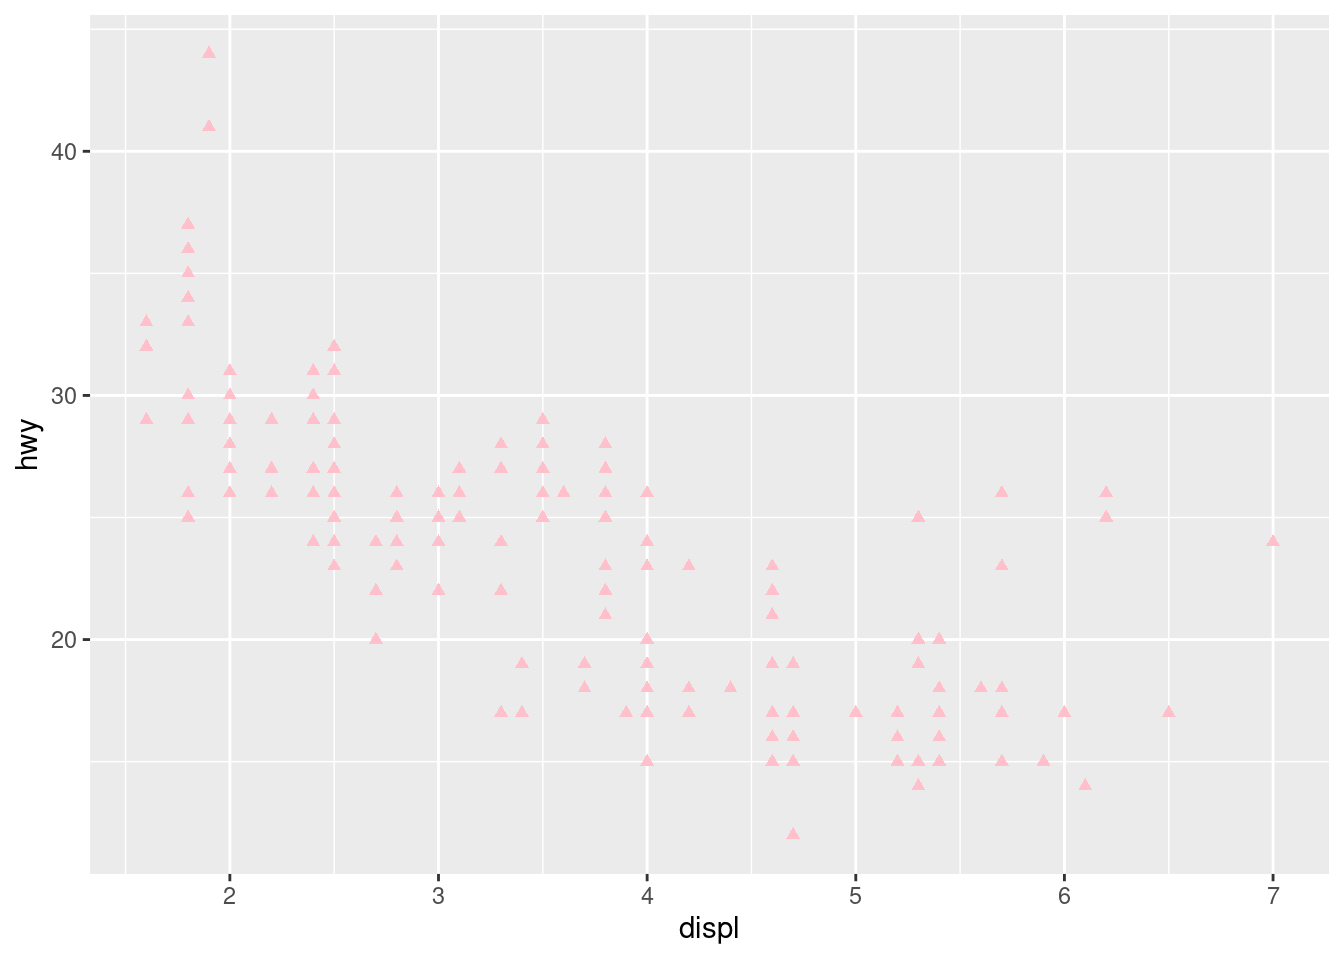
Create a scatterplot of hwy vs. displ where the points are pink filled in triangles.
ggplot(mpg, aes(x = displ, y = hwy)) +
  geom_point(color = "pink", shape= 17)
ggplot(mpg, aes(x = displ, y = hwy, color = displ < 5)) +
geom_point()