25.14 Plot functions
diamonds |>
  ggplot(aes(x = carat)) +
  geom_histogram(binwidth = 0.1)

diamonds |>
  ggplot(aes(x = carat)) +
  geom_histogram(binwidth = 0.05)
You can take the code above and create a function, keeping in mind that aes() is a data-masking function and you’ll need to embrace.
histogram <- function(df, var, binwidth = NULL) {
  df |>
    ggplot(aes(x = {{ var }})) +
    geom_histogram(binwidth = binwidth)
}

diamonds |>
  histogram(carat, 0.1)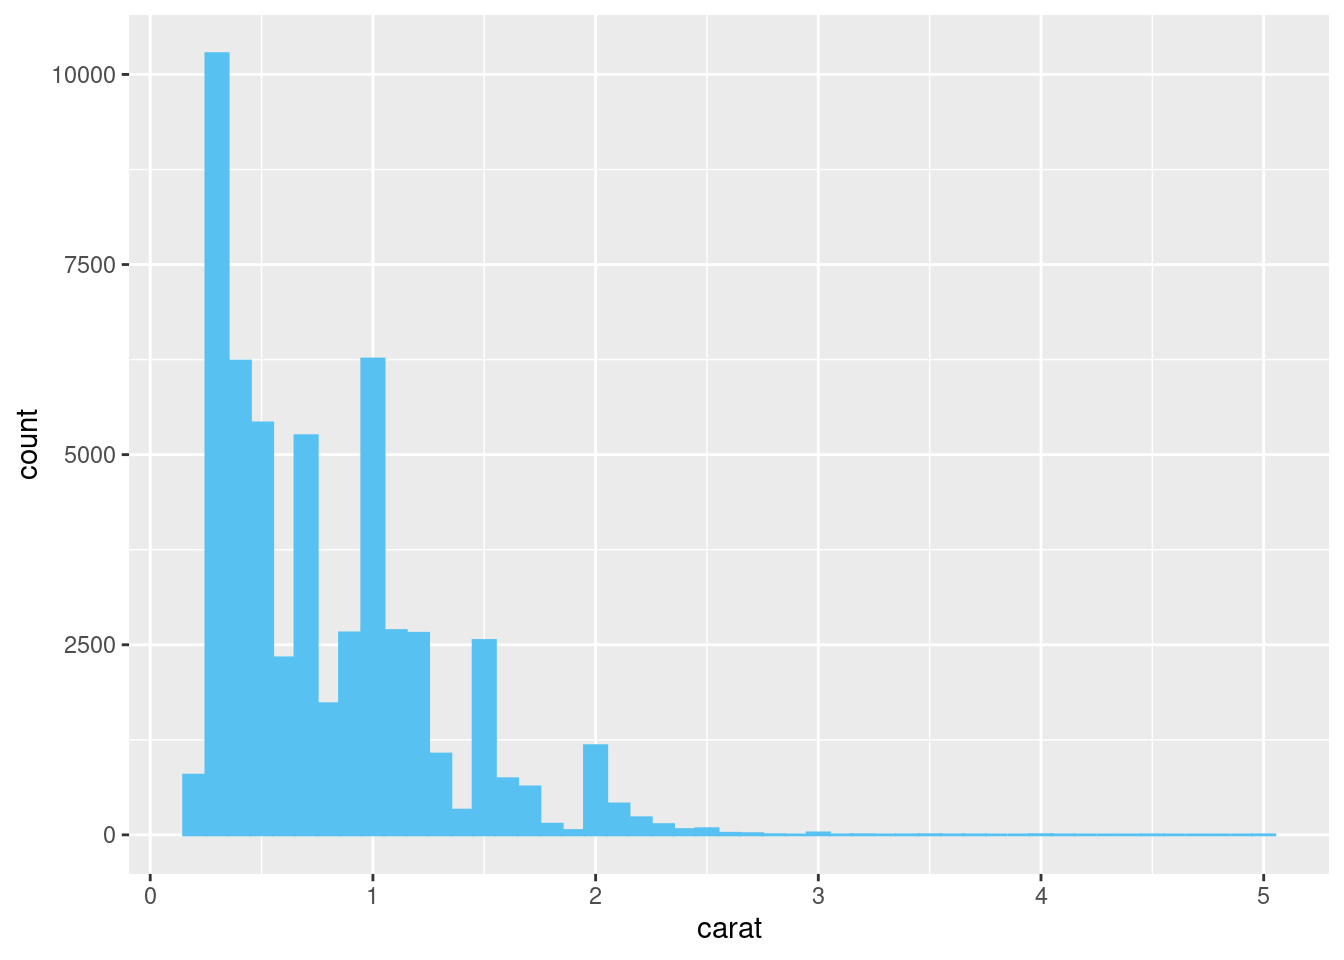
Note that because histogram() returns a ggplot2 plot, meaning you can still add on additional components if you want. Just remember to switch from |> to +: