1 Data visualisation
Learning objectives:
- Produce a simple plot with
ggplot2 - Use different
aesthetic mappings andgeom_*()functions to produce more complex plots - Visualize distributions and relationships in data
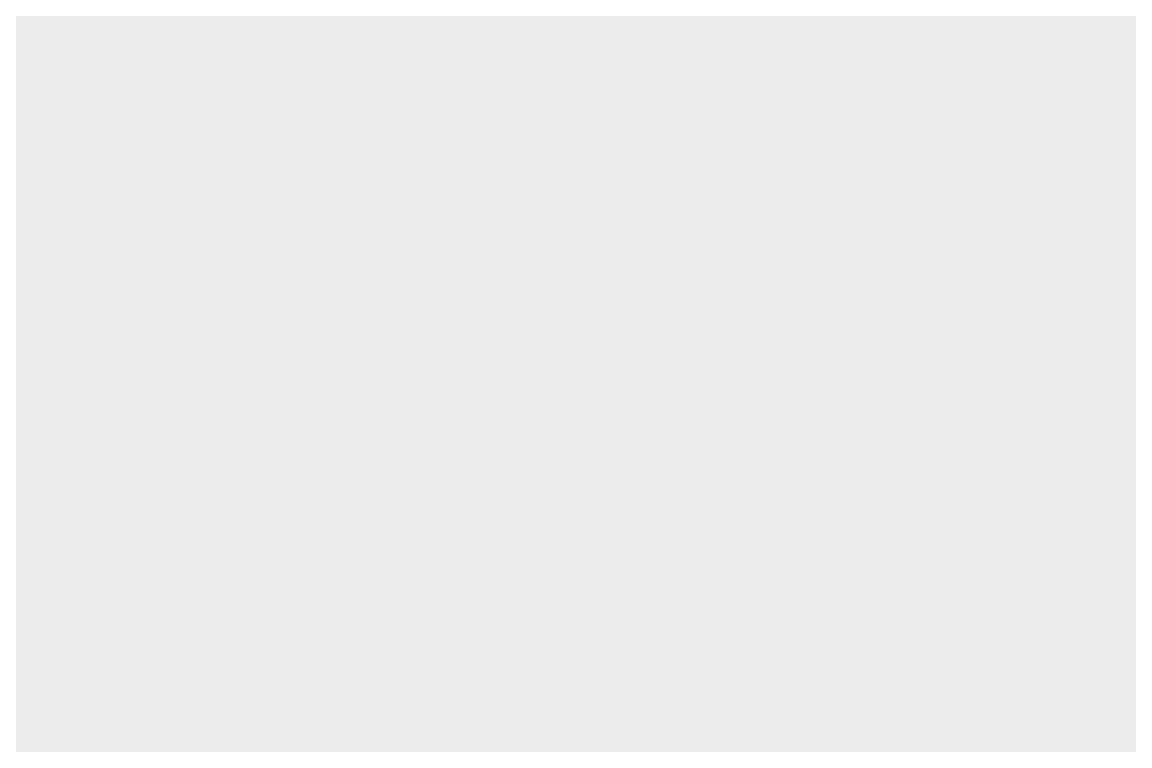
- Produce small multiples with
facet() - Make the plot to the right