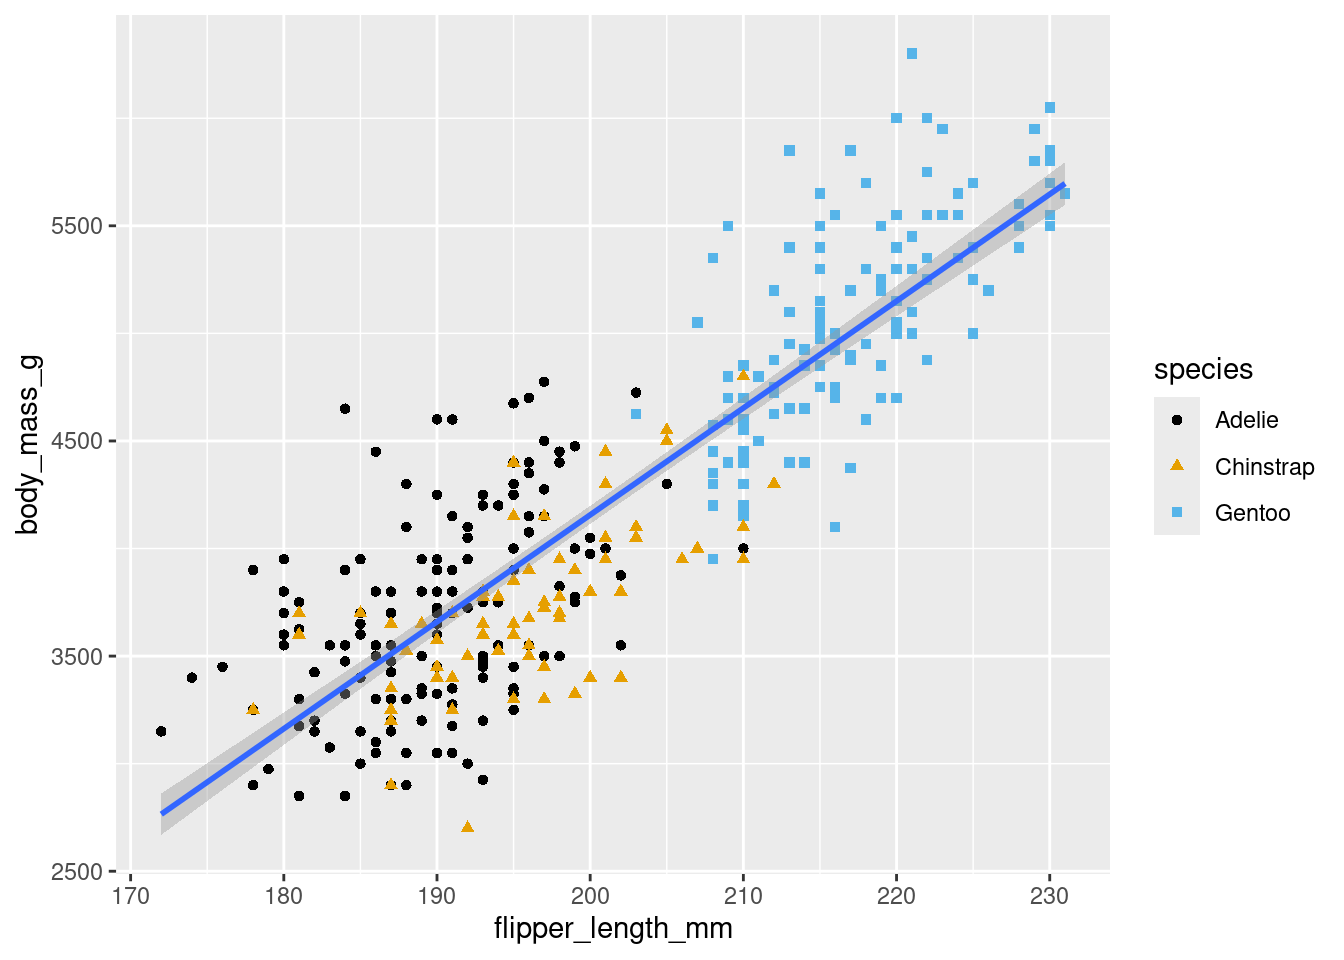
Improving Accessibility
- Mapping shape and color may help colorblind readers
- Colorblind-friendly palette would help, too
ggplot(
  data = penguins,
  mapping = aes(x = flipper_length_mm, y = body_mass_g)
) +
  geom_point(aes(color = species, shape = species)) +
  geom_smooth(method = "lm") +
  scale_color_colorblind()