9.16 Statistical transformations

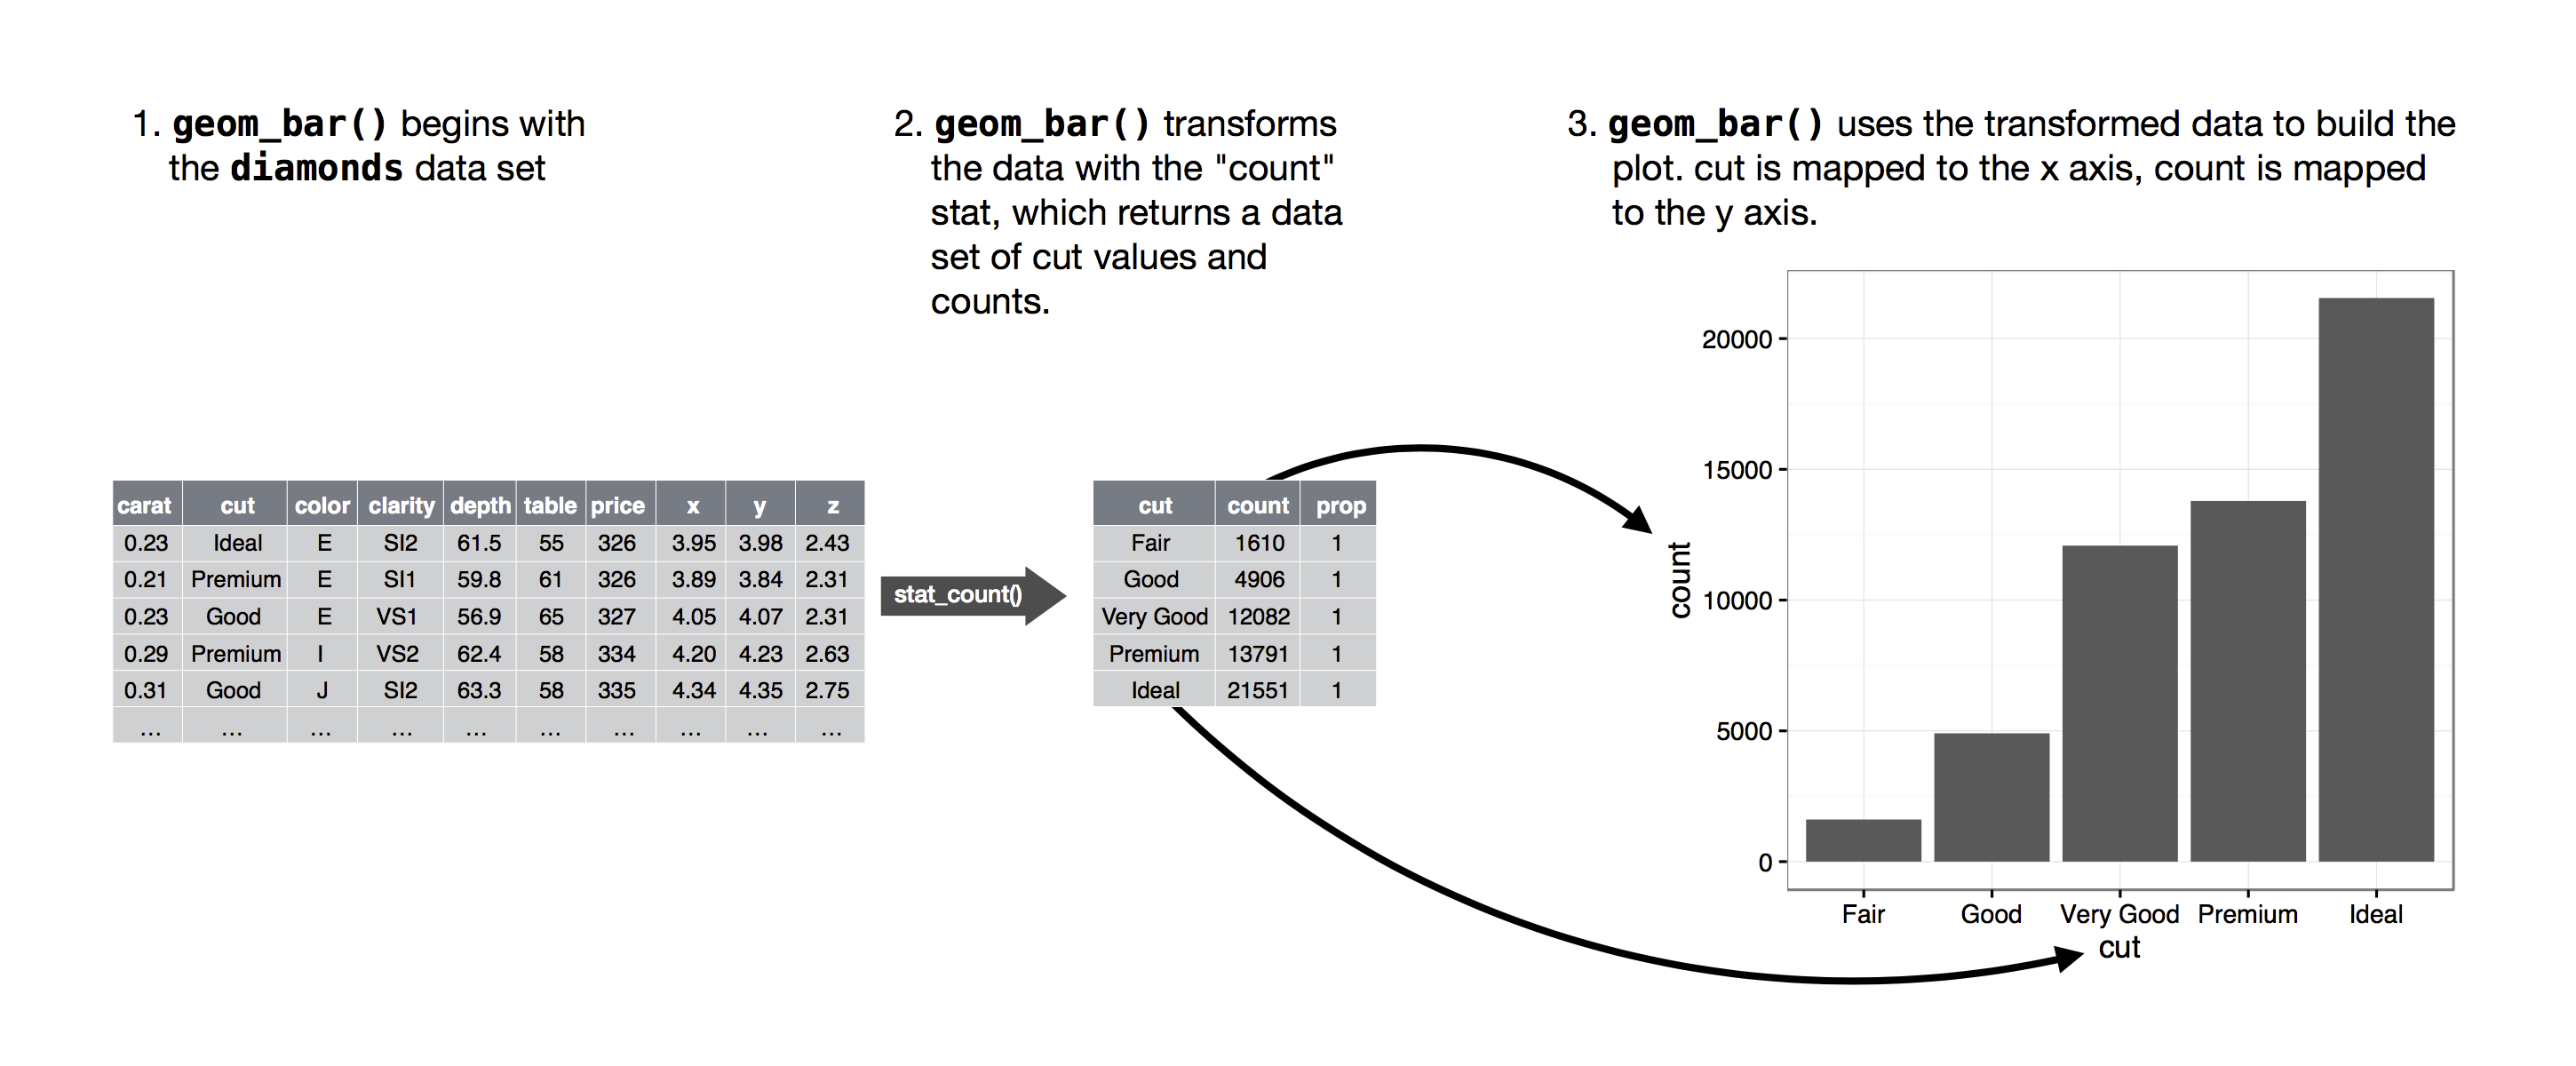
We can learn which stat a geom uses by inspecting the default value for the stat argument. For example, ?geom_bar shows that the default value for stat is “count”, which means that geom_bar() uses stat_count(). stat_count() is documented on the same page as geom_bar().
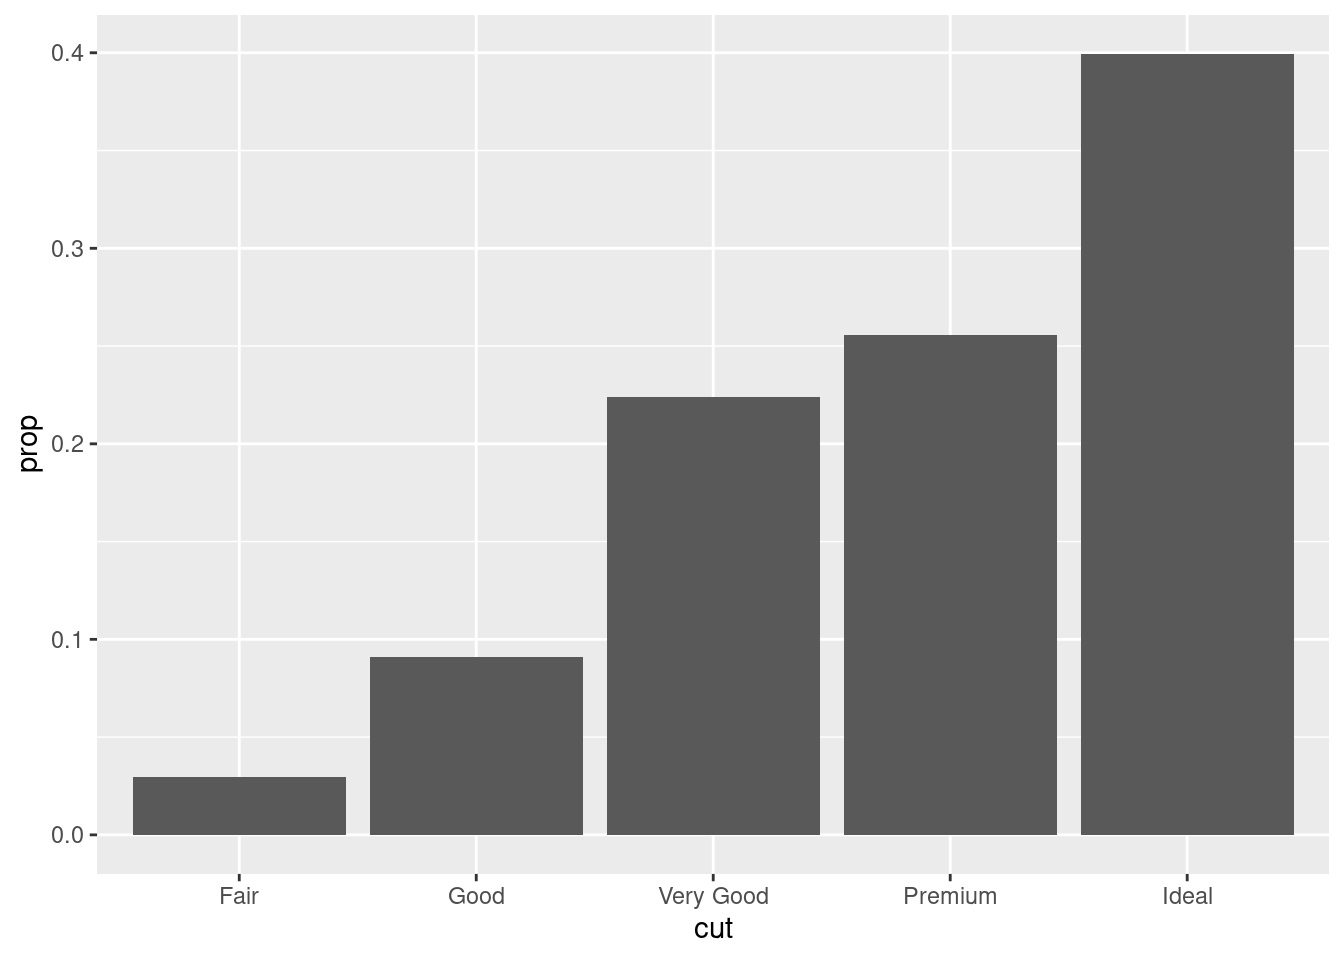
We might want to override the default mapping from transformed variables to aesthetics. For example, you might want to display a bar chart of proportions, rather than counts:
- We might want to draw greater attention to the statistical transformation in your code. For example, you might use stat_summary(), which summarizes the y values for each unique x value, to draw attention to the summary that you’re computing:
ggplot(diamonds) +
  stat_summary(
    aes(x = cut, y = depth),
    fun.min = min,
    fun.max = max,
    fun = median
  )
- ggplot2 provides more than 20 stats for you to use. Each stat is a function, so you can get help in the usual way, e.g. ?stat_bin.