9.9 Geometric objects
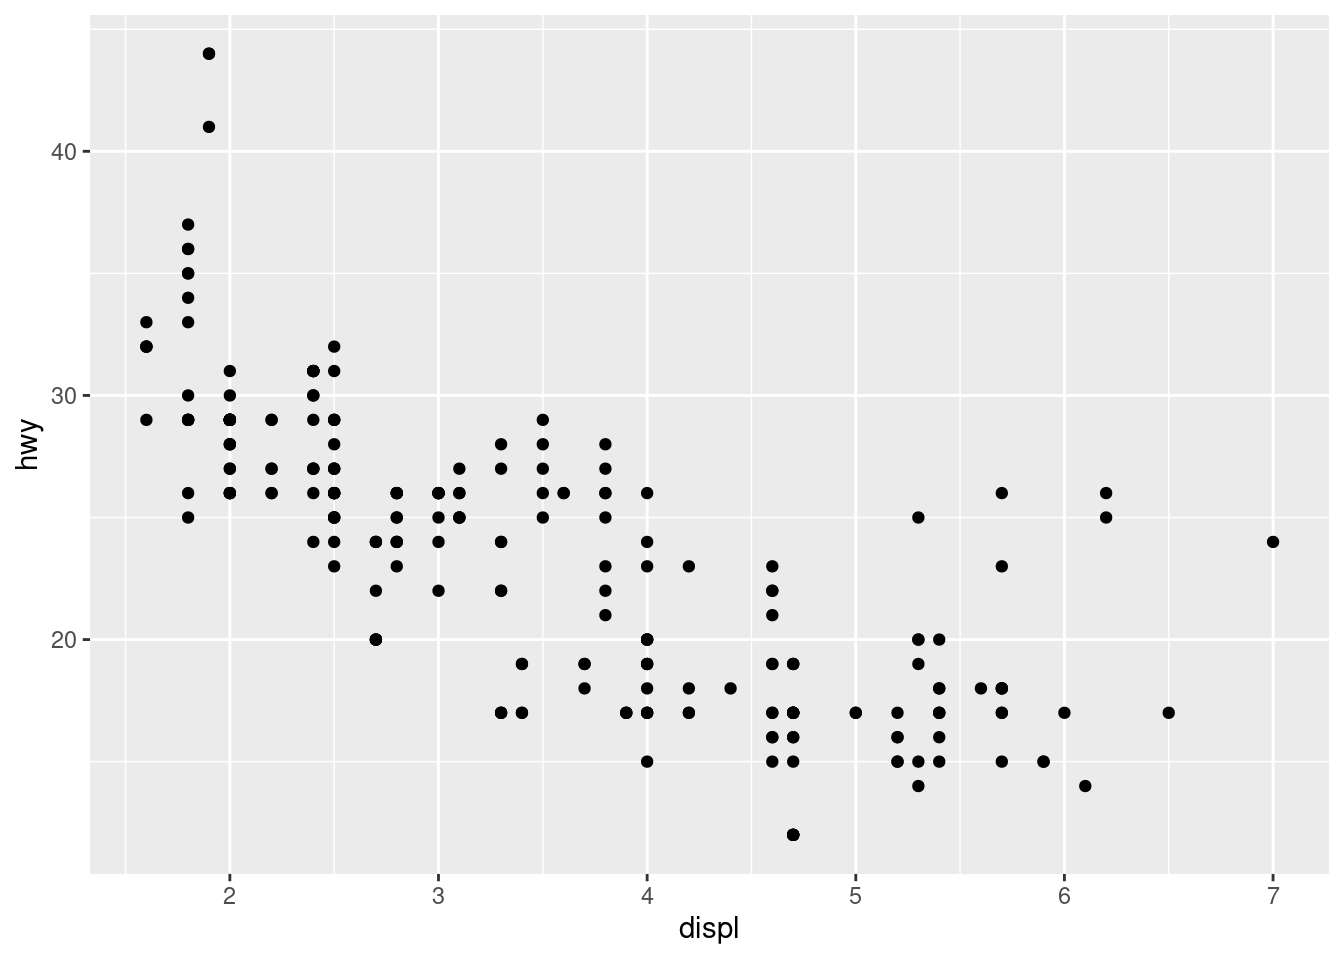
- The plots below contain the same x variable, the same y variable, and both describe the same data, but are not identical because each plot uses a different geometric object, geom, to represent the data.
par(mar = c(4, 4, .1, .1))

# Left
ggplot(mpg, aes(x = displ, y = hwy)) +
  geom_point()

# Right
ggplot(mpg, aes(x = displ, y = hwy)) +
  geom_smooth()
## `geom_smooth()` using method = 'loess' and formula = 'y ~ x'