9.20 Coordinate systems
Coordinate systems are probably the most complicated part of ggplot2. The default coordinate system is the Cartesian coordinate system where the x and y positions act independently to determine the location of each point. There are two other coordinate systems that are occasionally helpful.
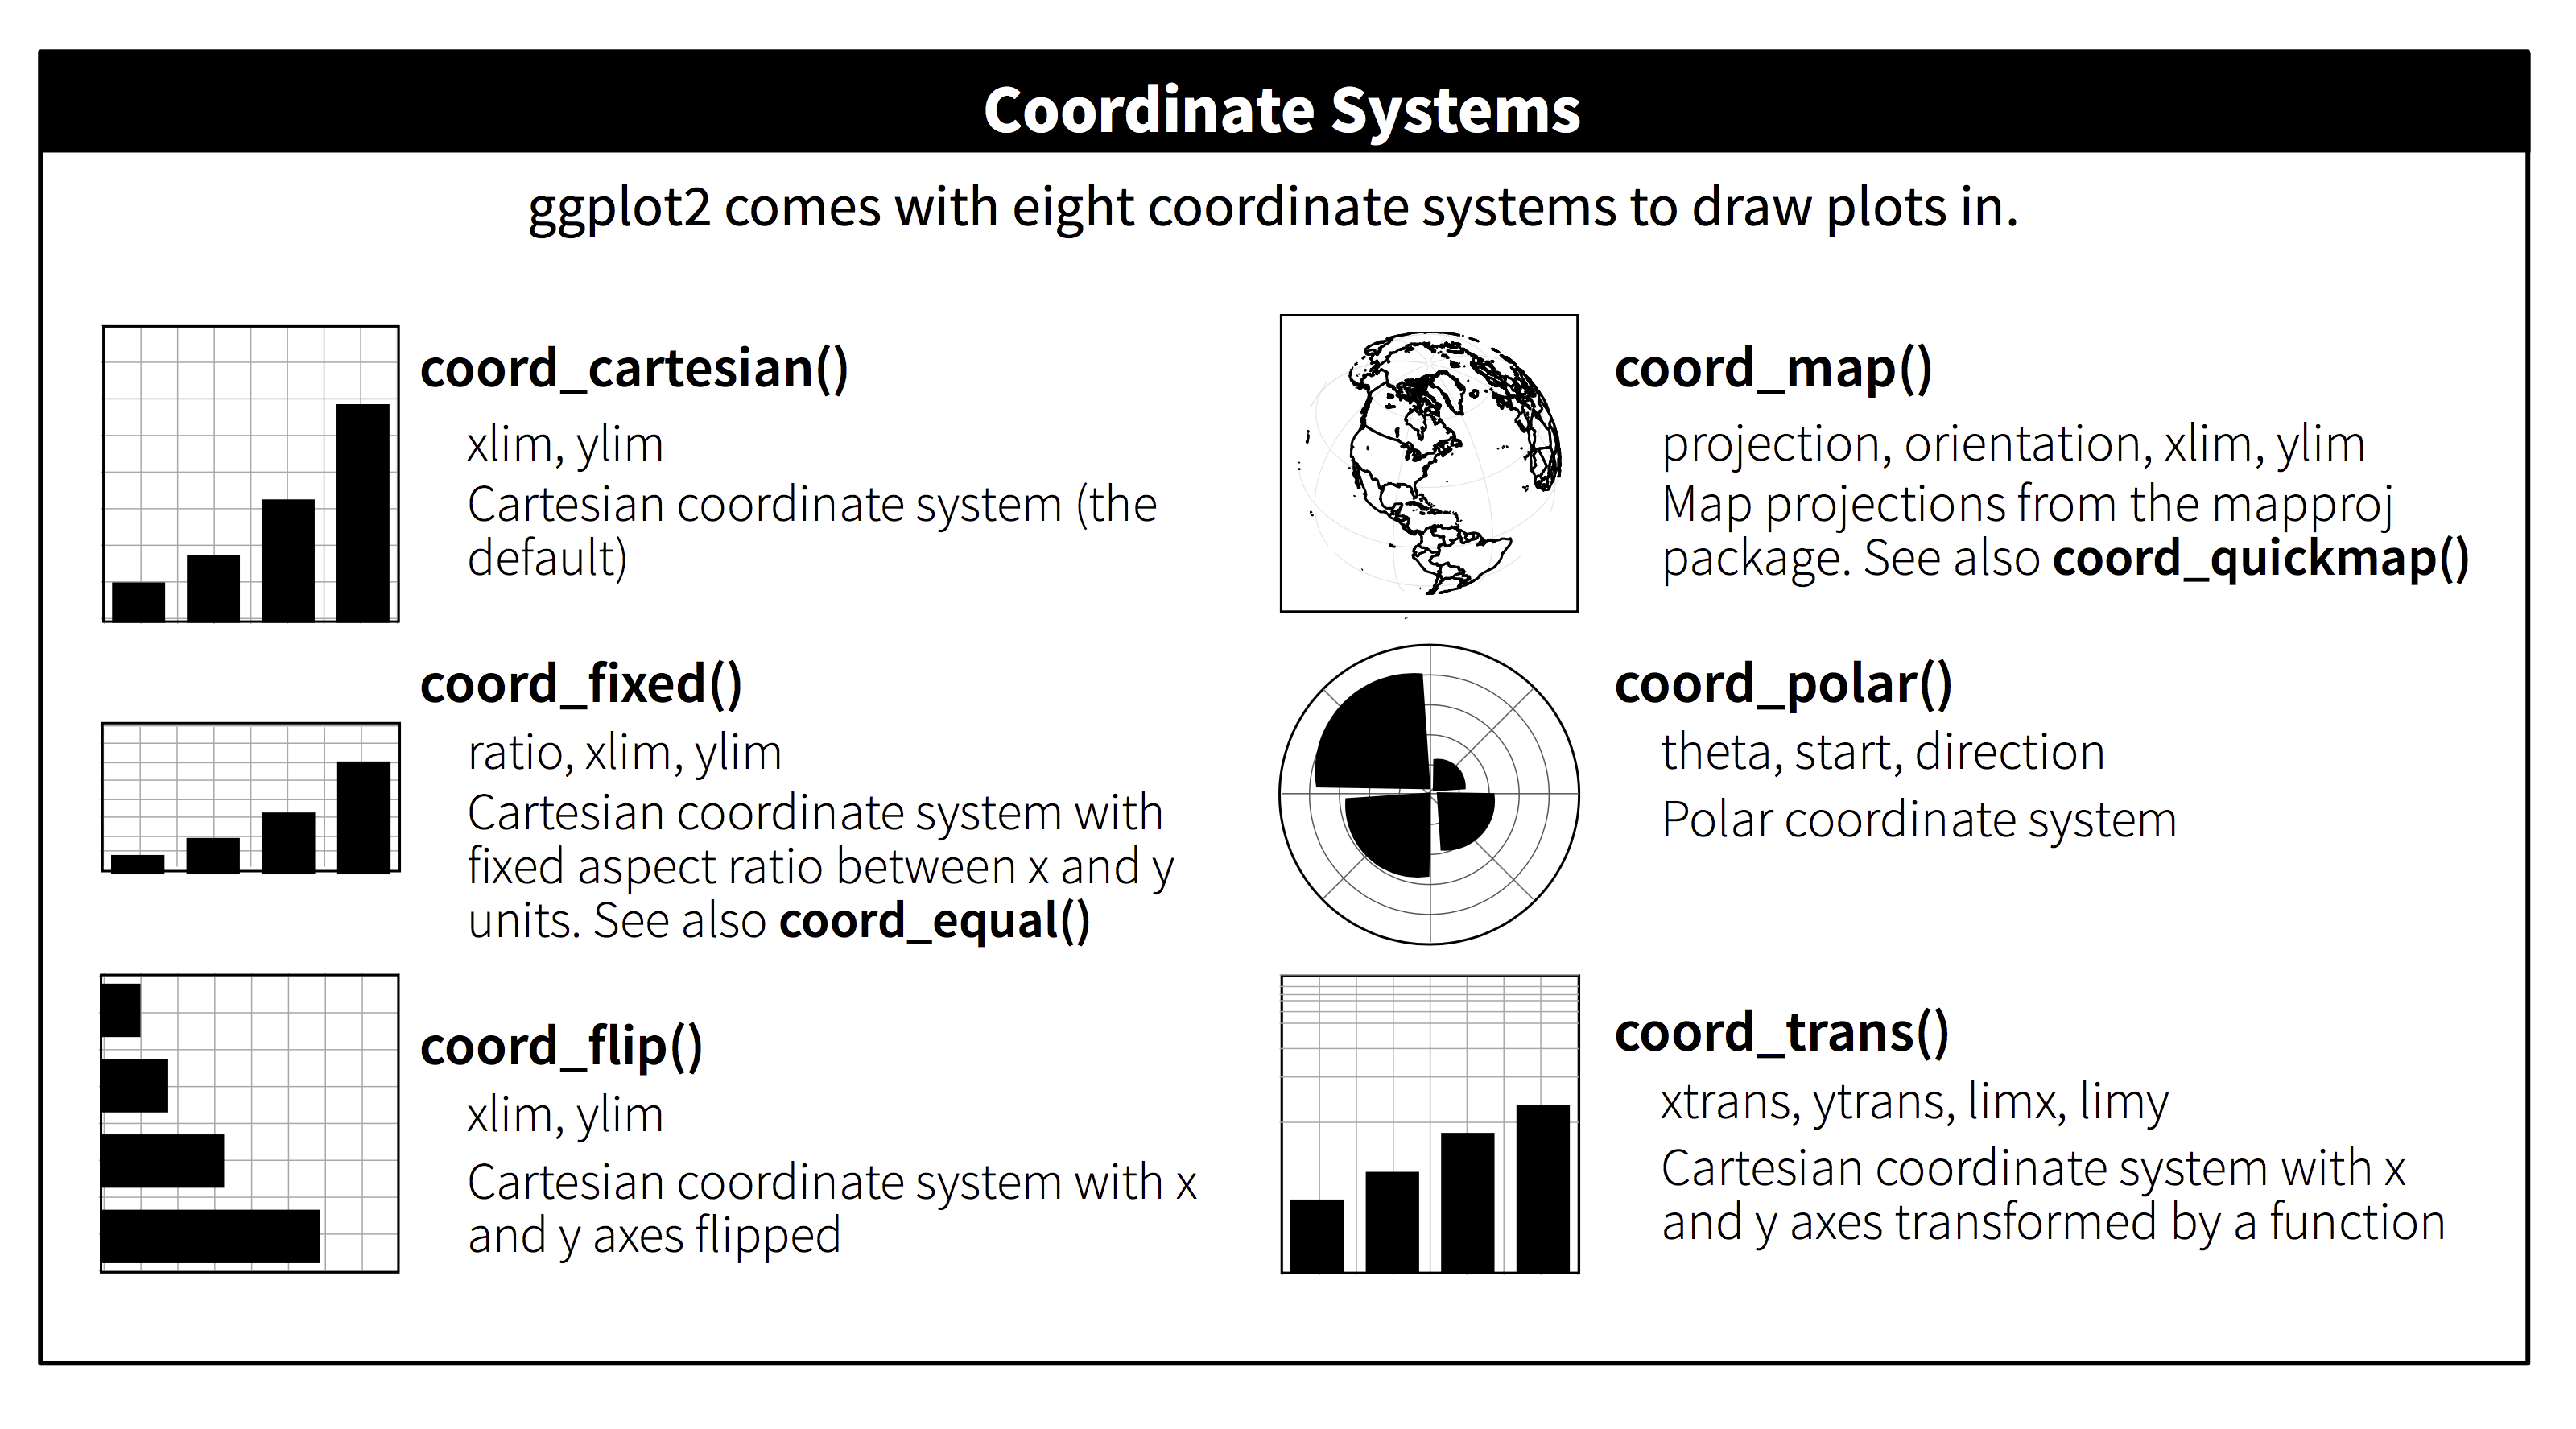
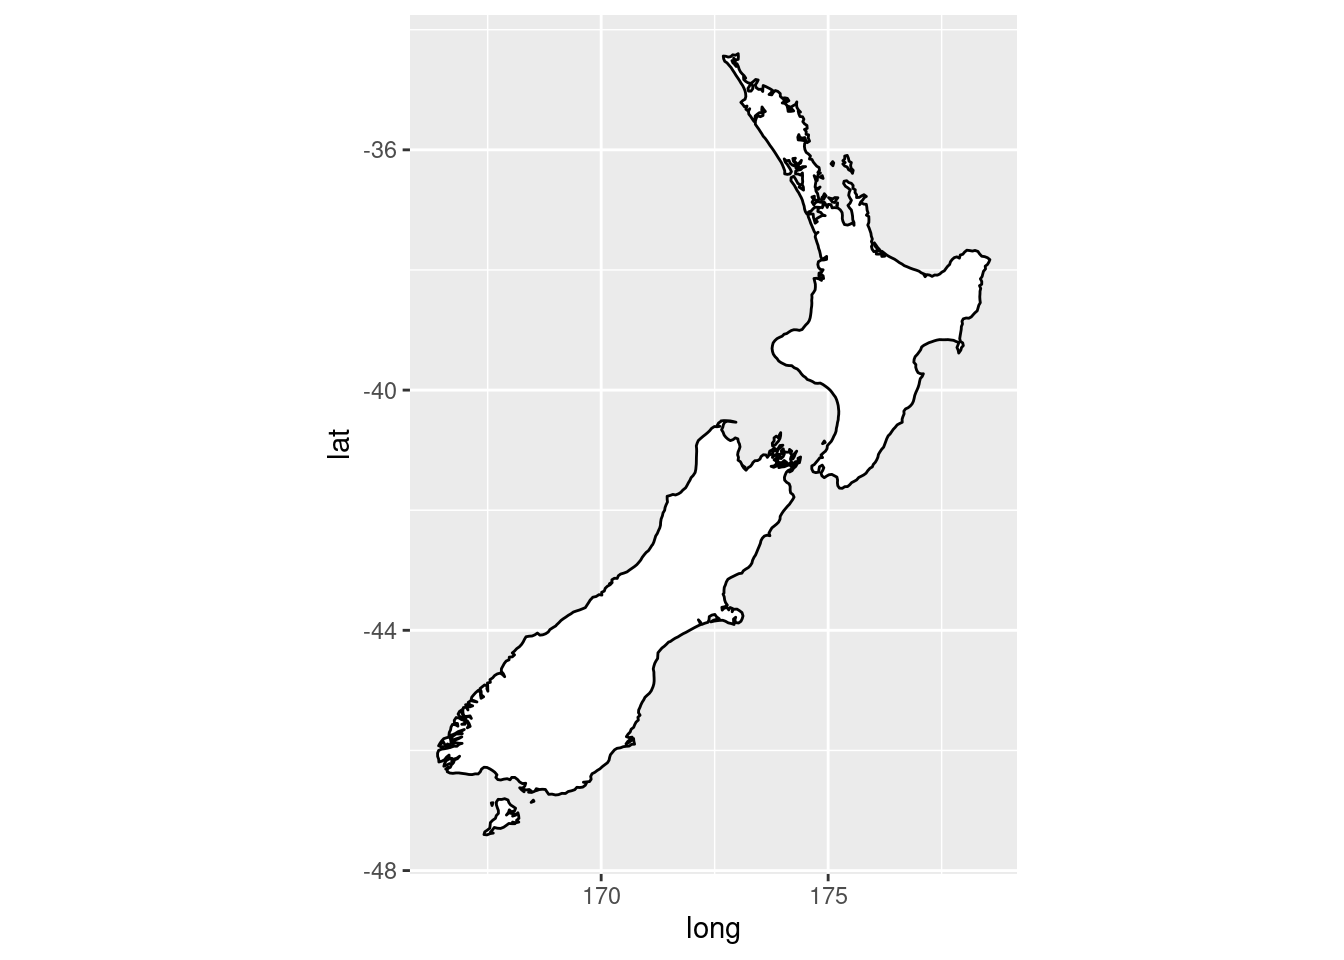
- coord_quickmap() sets the aspect ratio correctly for maps. This is very important if you’re plotting spatial data with ggplot2. We don’t have the space to discuss maps in this book, but you can learn more in the Maps chapter of ggplot2: Elegant graphics for data analysis.
par(mar = c(4, 4, .1, .1))

nz <- map_data("nz")

ggplot(nz, aes(x = long, y = lat, group = group)) +
  geom_polygon(fill = "white", color = "black")

ggplot(nz, aes(x = long, y = lat, group = group)) +
  geom_polygon(fill = "white", color = "black") +
  coord_quickmap()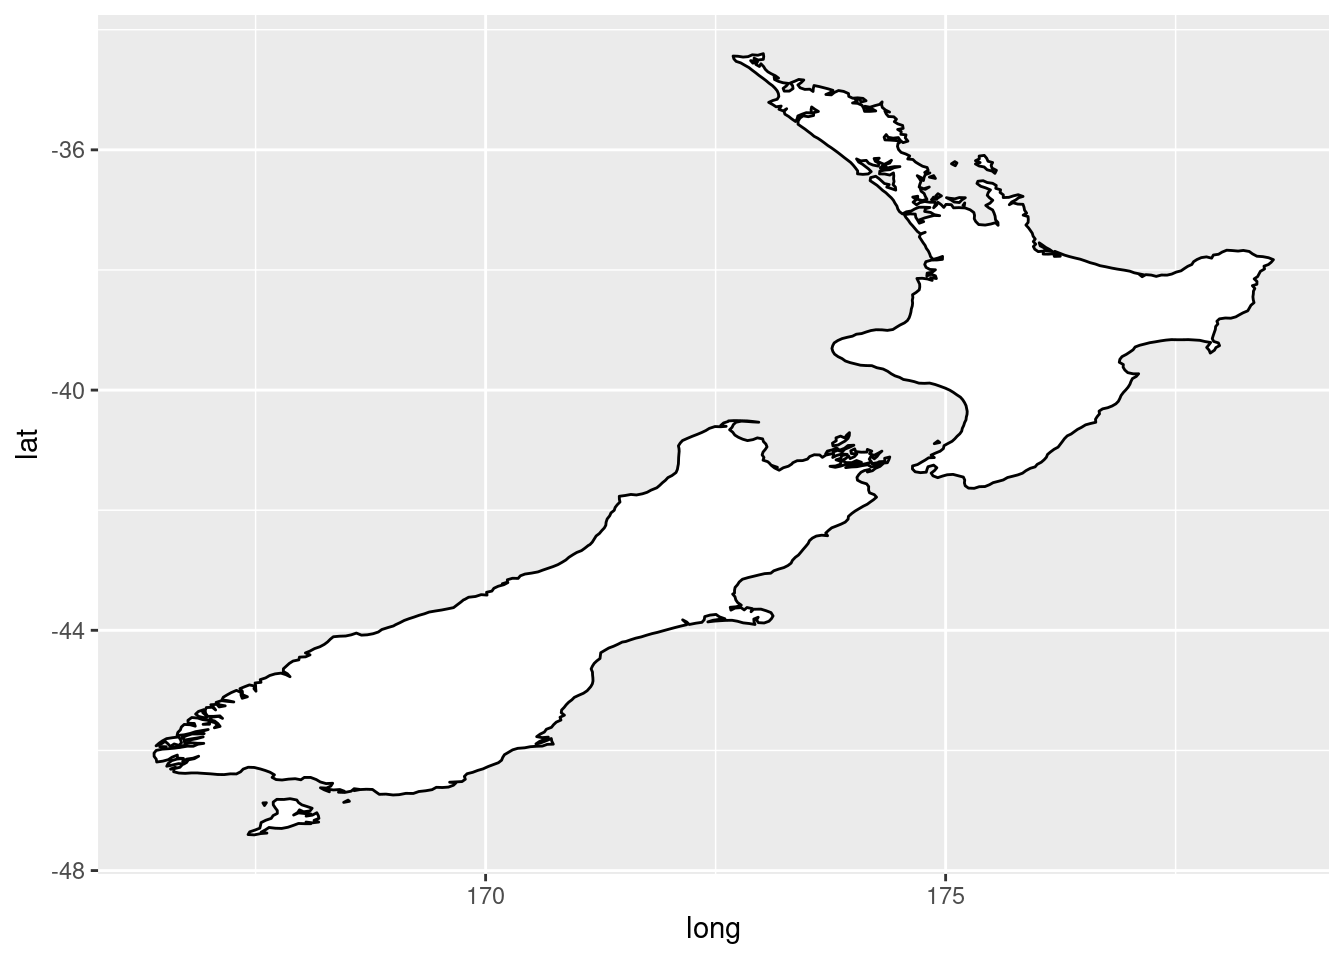
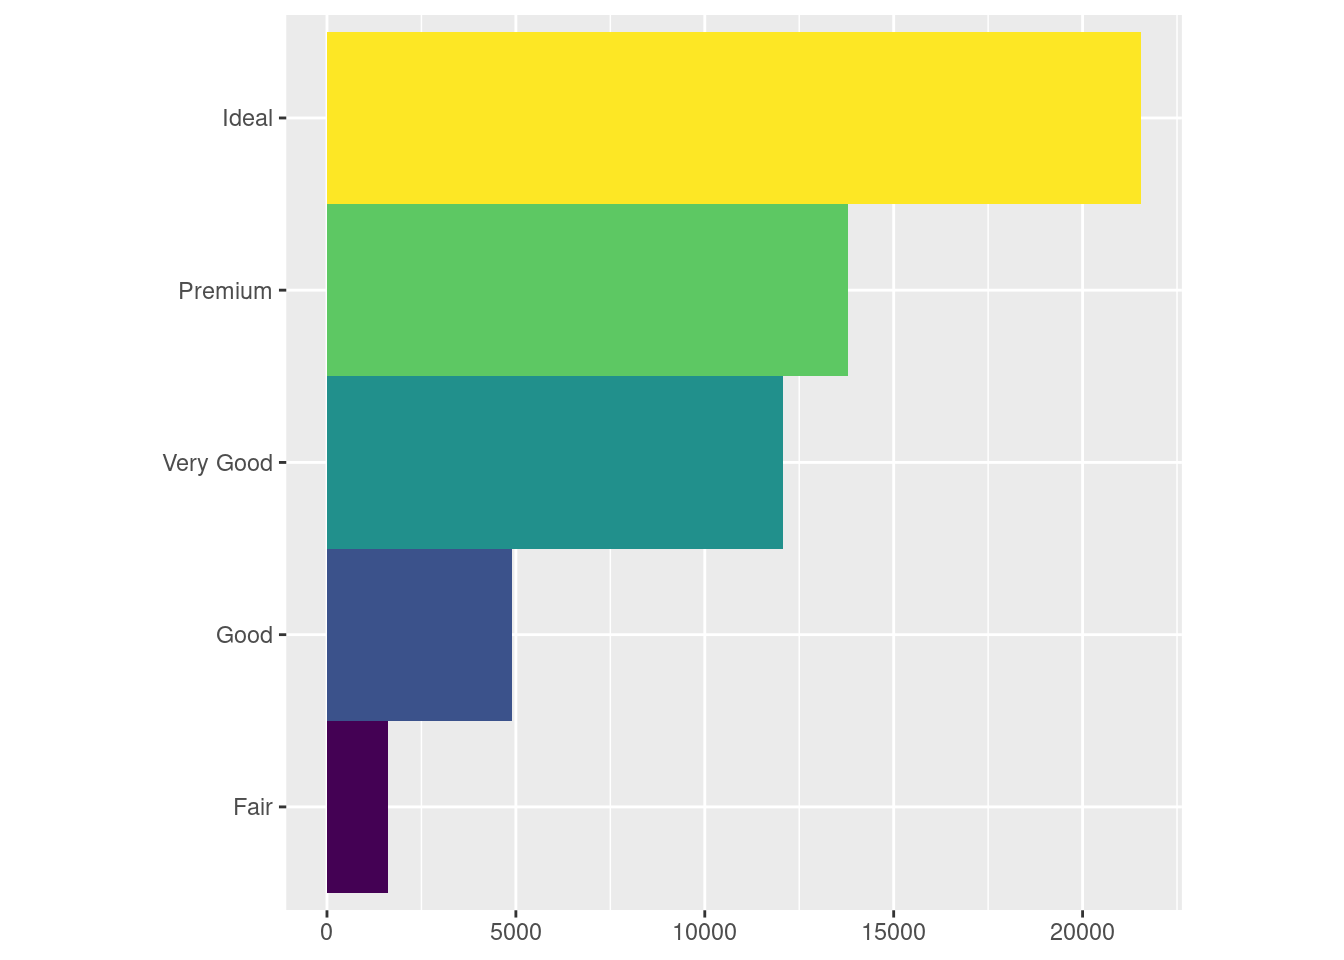
par(mar = c(4, 4, .1, .1))

bar <- ggplot(data = diamonds) +
  geom_bar(
    mapping = aes(x = cut, fill = cut),
    show.legend = FALSE,
    width = 1
  ) +
  theme(aspect.ratio = 1) +
  labs(x = NULL, y = NULL)

bar + coord_flip()
bar + coord_polar()