9.14 Facets
Facets are used to splits a plot into subplots that each display one subset of the data based on a categorical variable.
To facet your plot with the combination of two variables, switch from
facet_wrap(), which we learned about in chapter 2, tofacet_grid(), which uses a double sided formula,rows~cols.
par(mar = c(4, 4, .1, .1))
# Left
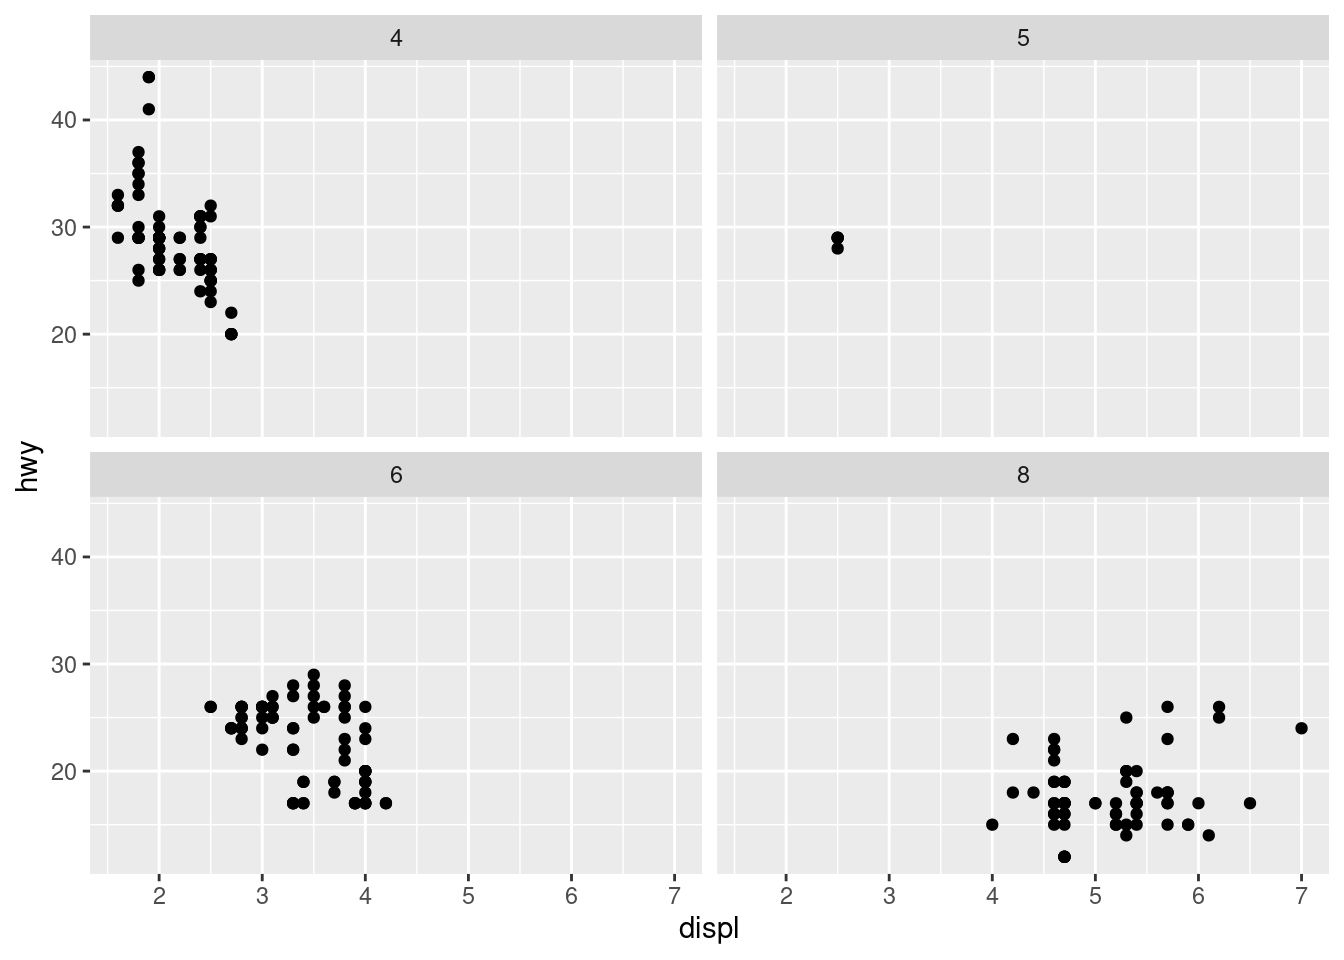
ggplot(mpg, aes(x = displ, y = hwy)) +
geom_point() +
facet_wrap(~cyl)
# Right
ggplot(mpg, aes(x = displ, y = hwy)) +
geom_point() +
facet_grid(drv ~ cyl)