palmerpenguins
ggplot2
names
values
readr::read_csv
janitor
skip = n
comment = "#"
col_names = FALSE
col_names
col_types
problems()
NA
\
fct_reorder()
dplyr::antijoin
forcats 1.0.0
join_by()
rescale01()
across()
[
[[
$
apply()
for()
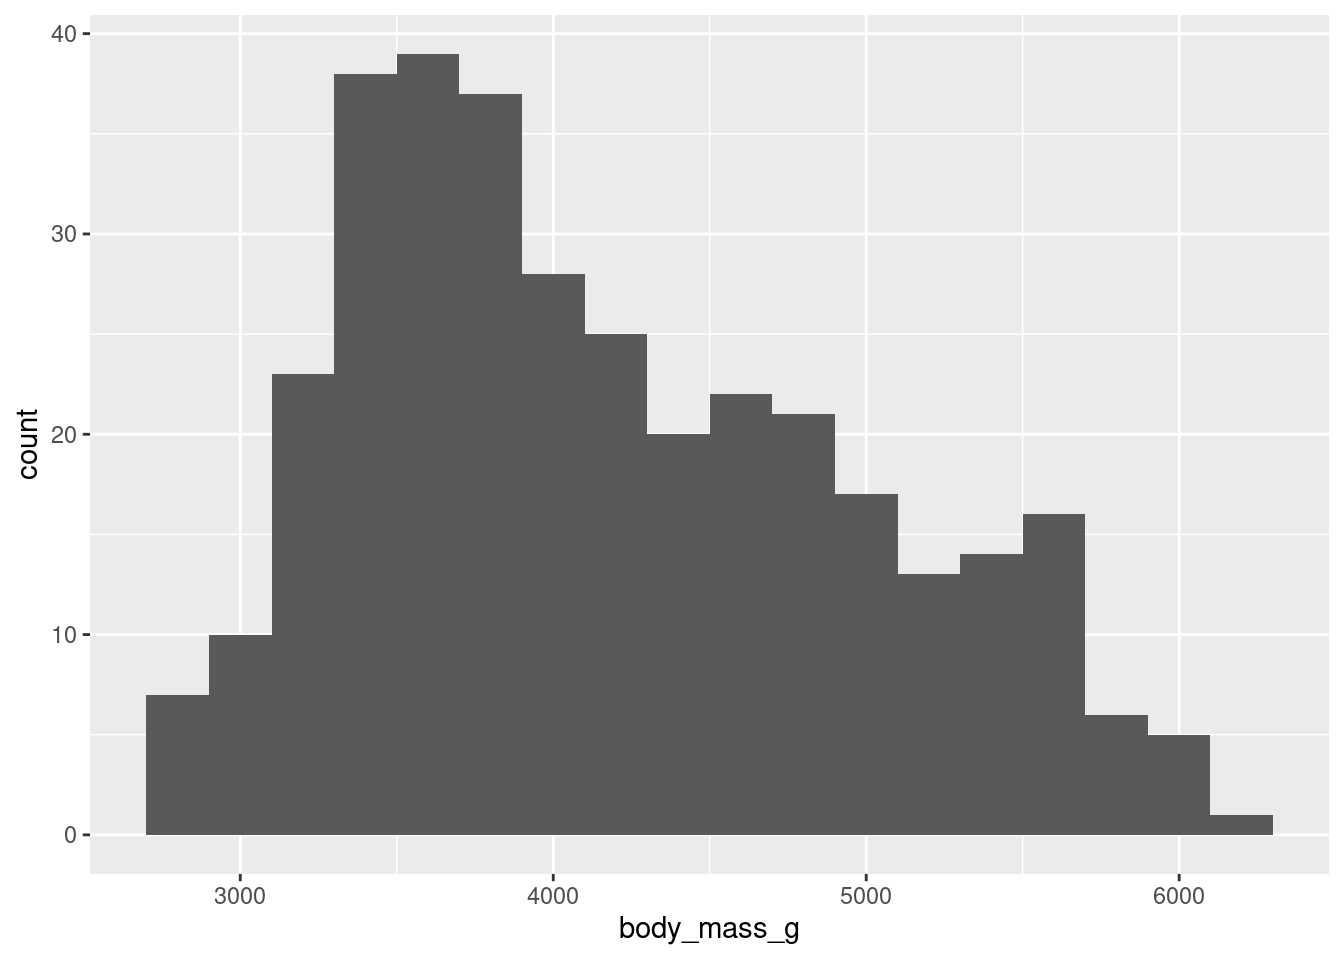
Histograms aid with numerical variables
ggplot(penguins, aes(x = body_mass_g)) +
  geom_histogram(binwidth = 200)