18.1 Introduction
We encountered missing values in previous chapters.
You first saw them in Chapter 1 where they resulted in a warning when making a plot
ggplot2::ggplot(
  data = palmerpenguins::penguins,
  mapping = ggplot2::aes(
      x = .data[["flipper_length_mm"]],
      y = .data[["body_mass_g"]]
      )
) +
ggplot2::geom_point()
## Warning: Removed 2 rows containing missing values or values outside the scale range
## (`geom_point()`).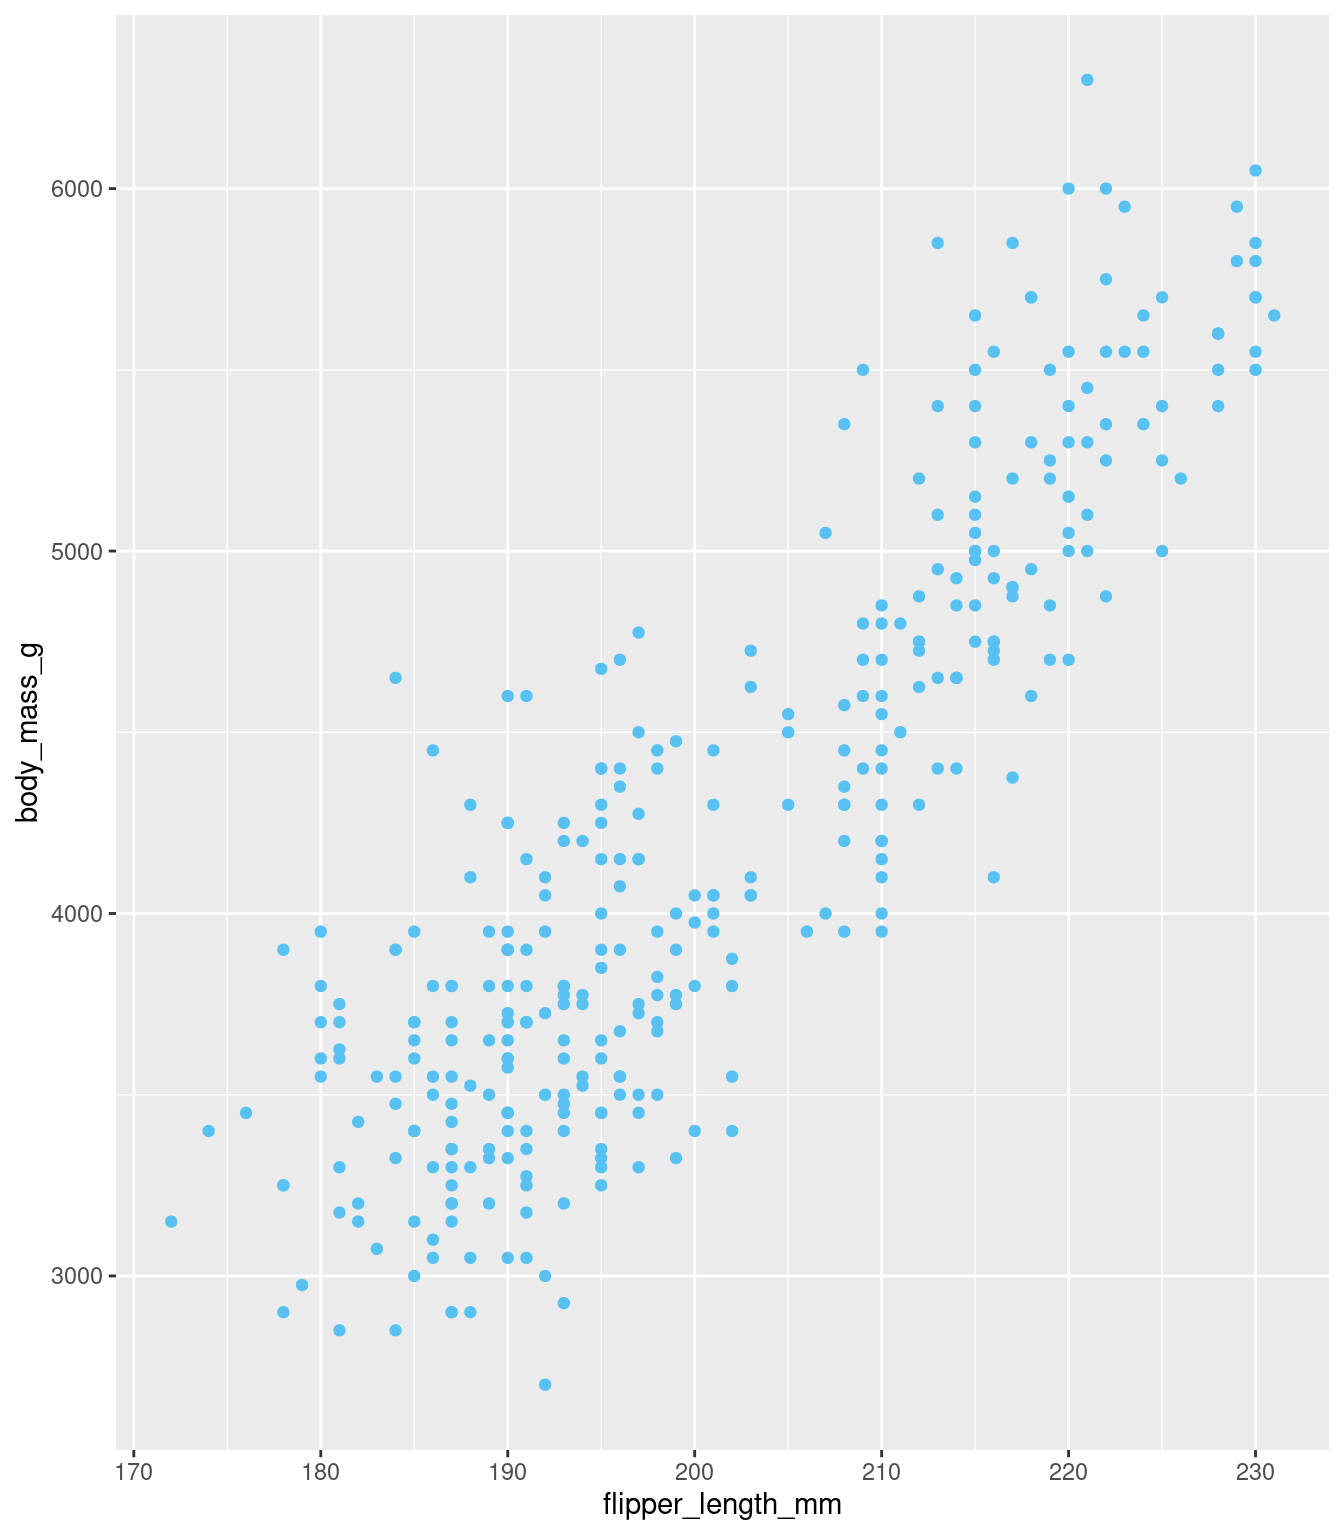
palmerpenguins::penguins |>
  dplyr::filter(
    is.na(flipper_length_mm) | is.na(body_mass_g)
  ) |>
  reactable::reactable(
    theme = reactablefmtr::dark(),
)nycflights13::flights |>
dplyr::group_by(.data[["month"]]) |>
dplyr::summarize(
avg_delay = mean(.data[["dep_delay"]])
) |>
reactable::reactable(
theme = reactablefmtr::dark(),
defaultPageSize = 5
)In Section 3.5.2 where they interfered with computing summary statistics
nycflights13::flights |>
  dplyr::group_by(.data[["month"]]) |>
  dplyr::summarize(
    avg_delay = mean(.data[["dep_delay"]],
                     na.rm = FALSE),
    avg_delay_corrected = mean(.data[["dep_delay"]],
                     na.rm = TRUE)
  ) |>
  reactable::reactable(
    theme = reactablefmtr::dark(),
    defaultPageSize = 5
  )
Their infectious nature and how to check for their presence in Section 12.2.2
## [1] NA## [1] NA## [1] NA## [1] TRUEWe learn more of the details in this chapter, covering additional tools (besides is.na and na.rm argument) for working with missing values
- Explicit missing values
- Implicit missing values
- Empty groups