9.3 Mapping categorical variables to aesthetics
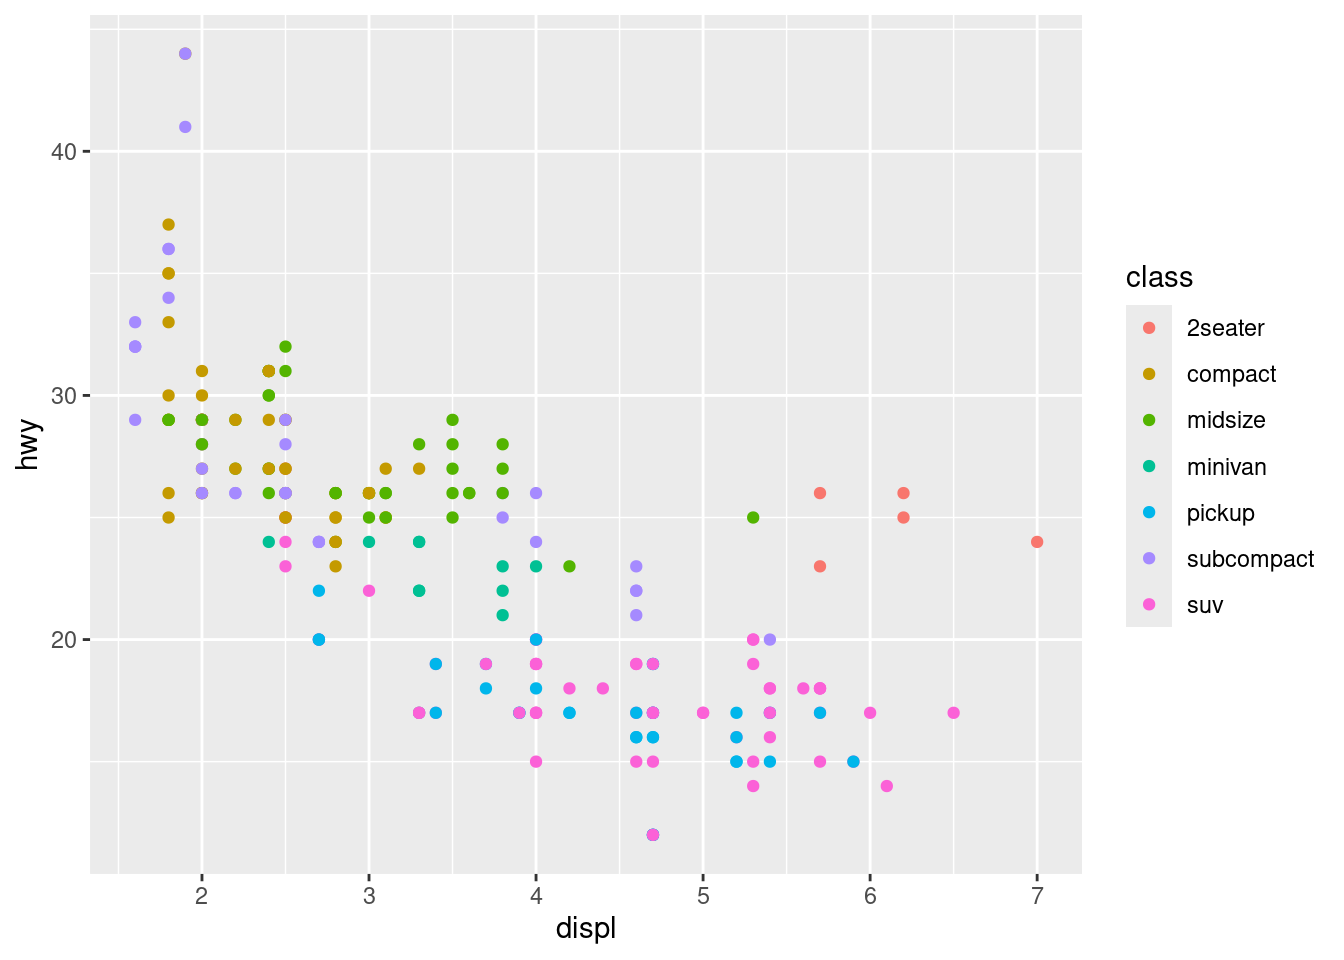
Let’s start by visualizing the relationship between
displandhwyfor variousclasses of cars.By default ggplot2 will only use six shapes at a time so additional groups will go unplotted when you use the shape aesthetic. There are 62 SUVs in the dataset and they’re not plotted.
par(mar = c(4, 4, .1, .1))

# Left
ggplot(mpg, aes(x = displ, y = hwy, color = class))+
geom_point()

# Right
ggplot(mpg, aes(x = displ, y = hwy, shape = class))+
geom_point()
## Warning: The shape palette can deal with a maximum of 6 discrete values because more
## than 6 becomes difficult to discriminate
## ℹ you have requested 7 values. Consider specifying shapes manually if you need
## that many have them.## Warning: Removed 62 rows containing missing values or values outside the scale range
## (`geom_point()`).