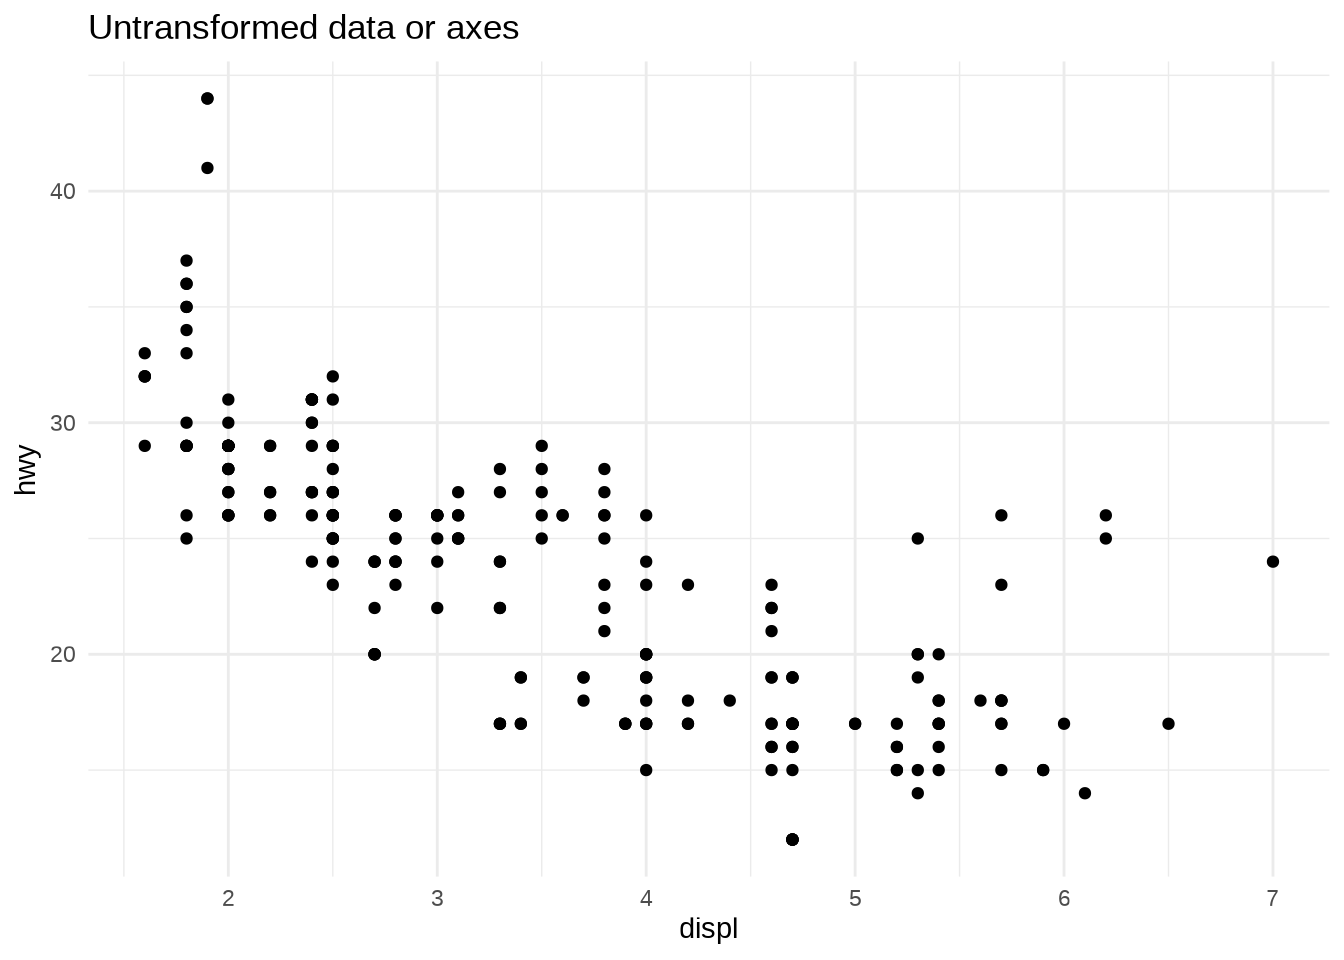
Transformations
- Several scale transformation functions that work on the x- or y-axis.
- All of these transformations do not affect the data, they just modify the axes.
- Every continuous scale takes a
transformargument allowing for using transformations:

You can construct your own transform by using
scales::new_transformThe following table lists some of the more common variants:
| Name | Transformer | Function \(f(x)\) | Inverse \(f^{-1}(x)\) |
|---|---|---|---|
"asn" |
scales::transform_asn |
\(\tanh^{-1}(x)\) | \(\tanh(y)\) |
"exp" |
scales::transform_exp () |
\(e ^ x\) | \(\log(y)\) |
"identity" |
scales::transform_identity() |
\(x\) | \(y\) |
"log" |
scales::transform_log() |
\(\log(x)\) | \(e ^ y\) |
"log10" |
scales::transform_log10() |
\(\log_{10}(x)\) | \(10 ^ y\) |
"log2" |
scales::transform_log2() |
\(\log_2(x)\) | \(2 ^ y\) |
"logit" |
scales::transform_logit() |
\(\log(\frac{x}{1 - x})\) | \(\frac{1}{1 + e(y)}\) |
"probit" |
scales::transform_probit() |
\(\Phi(x)\) | \(\Phi^{-1}(y)\) |
"reciprocal" |
scales::transform_reciprocal() |
\(x^{-1}\) | \(y^{-1}\) |
"reverse" |
scales::transform_reverse() |
\(-x\) | \(-y\) |
"sqrt" |
scales::scale_x_sqrt() |
\(x^{1/2}\) | \(y ^ 2\) |
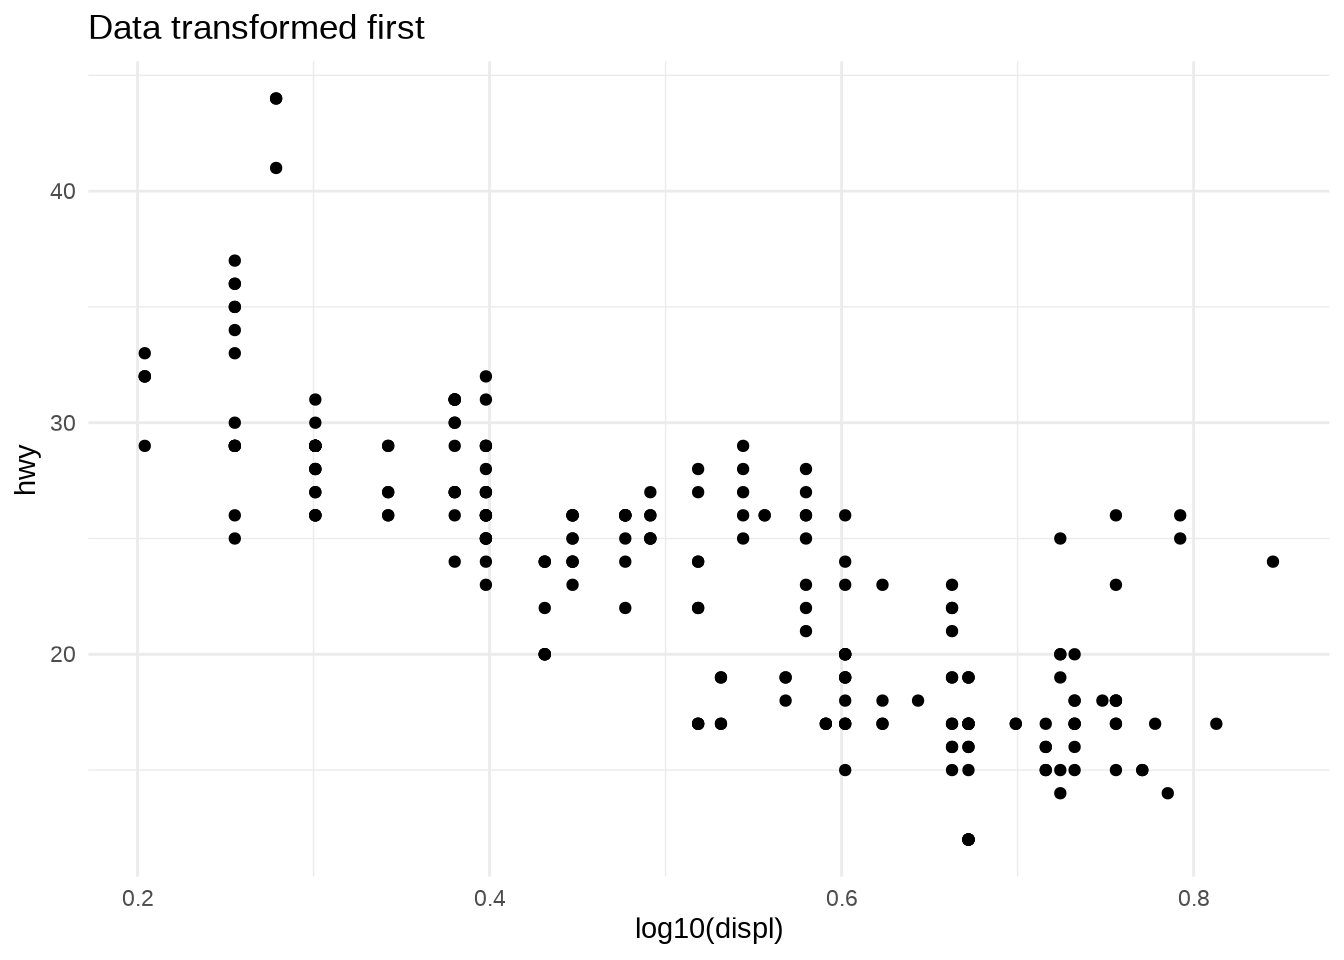
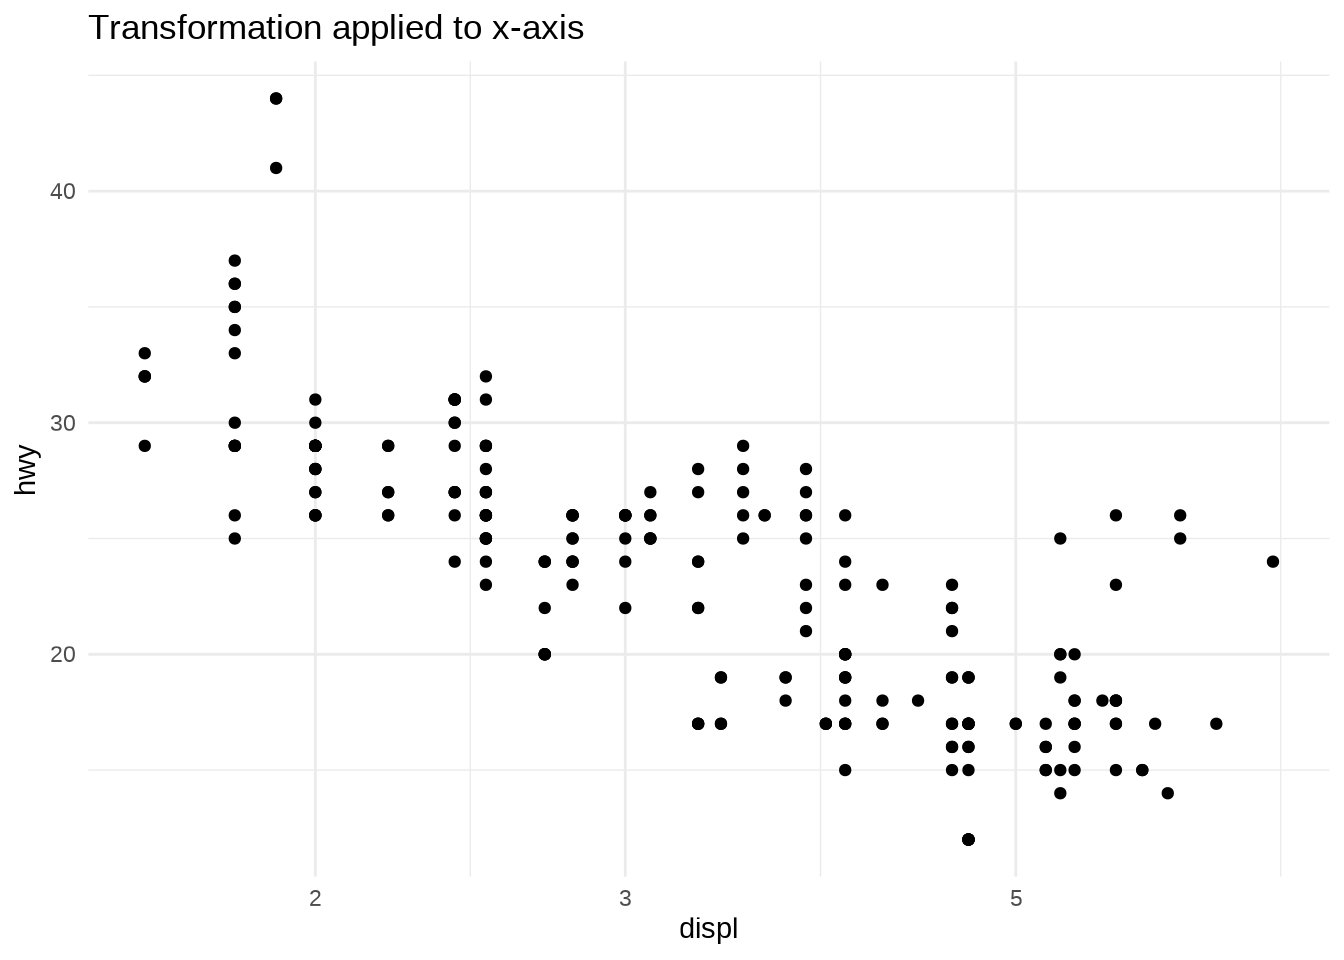
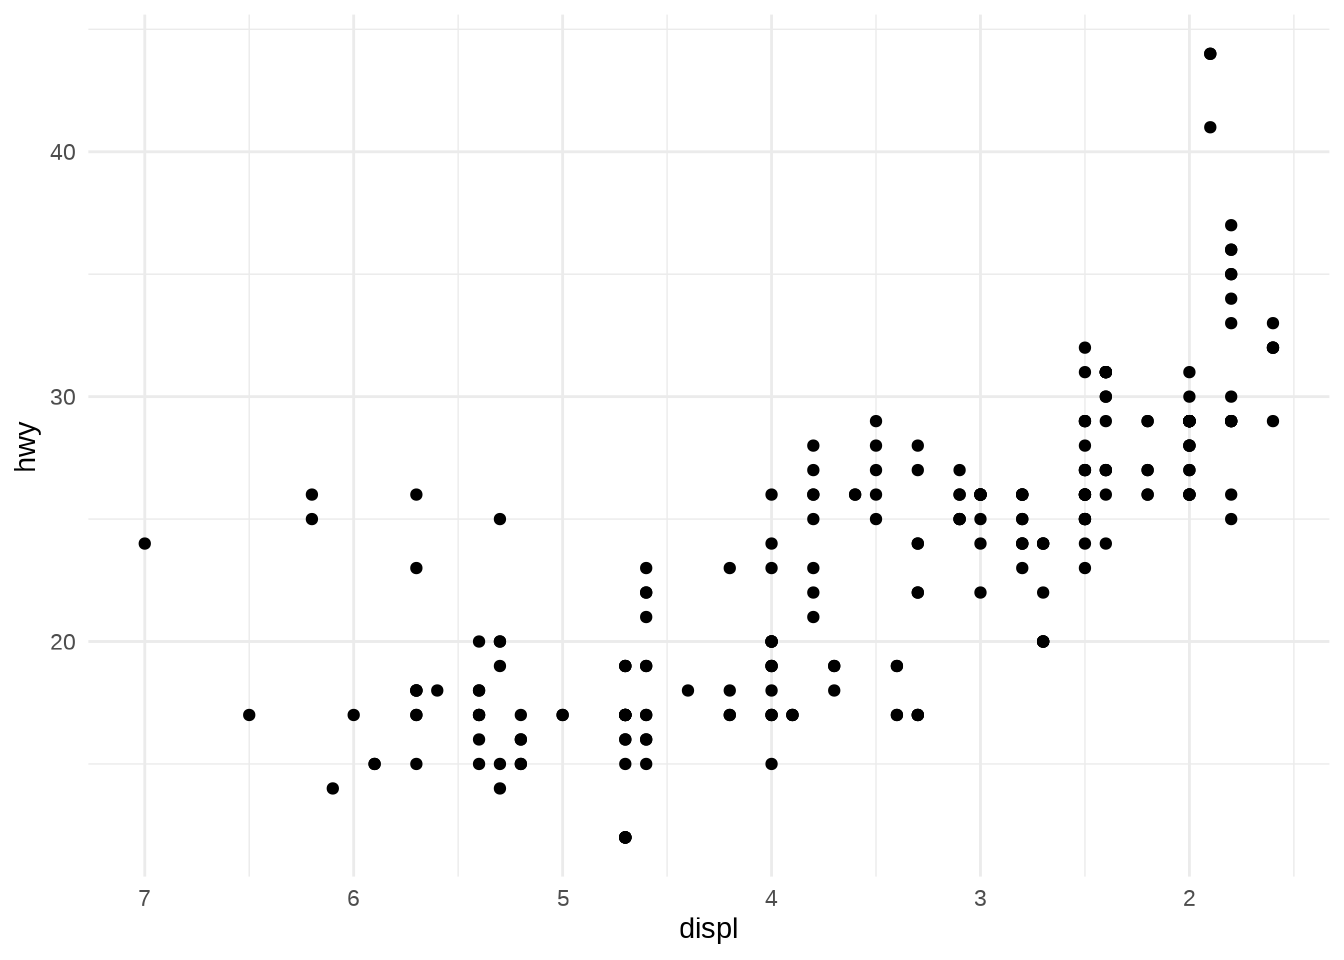
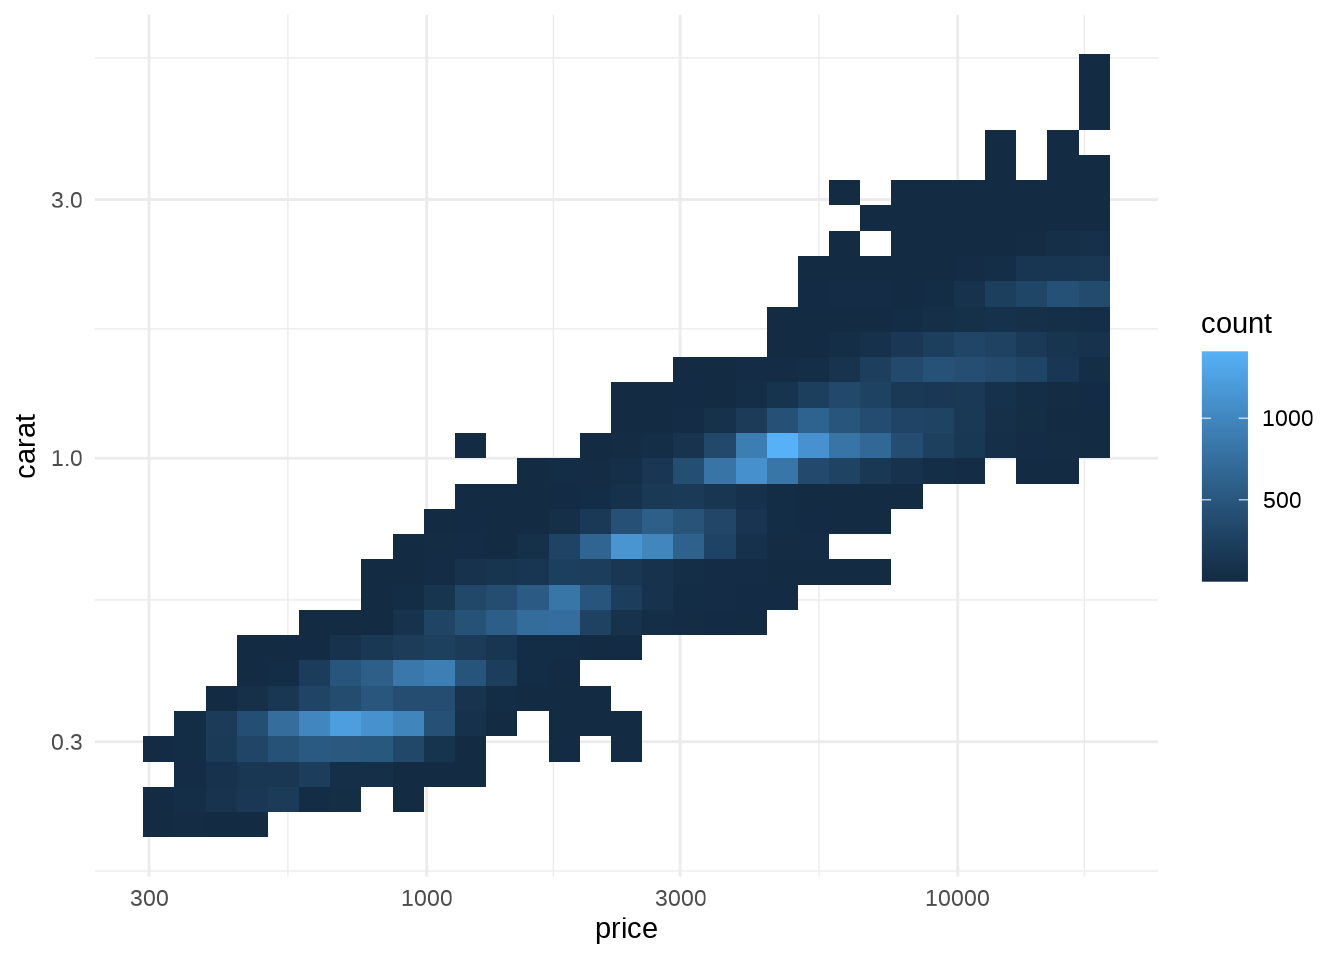
- Let’s see an example:

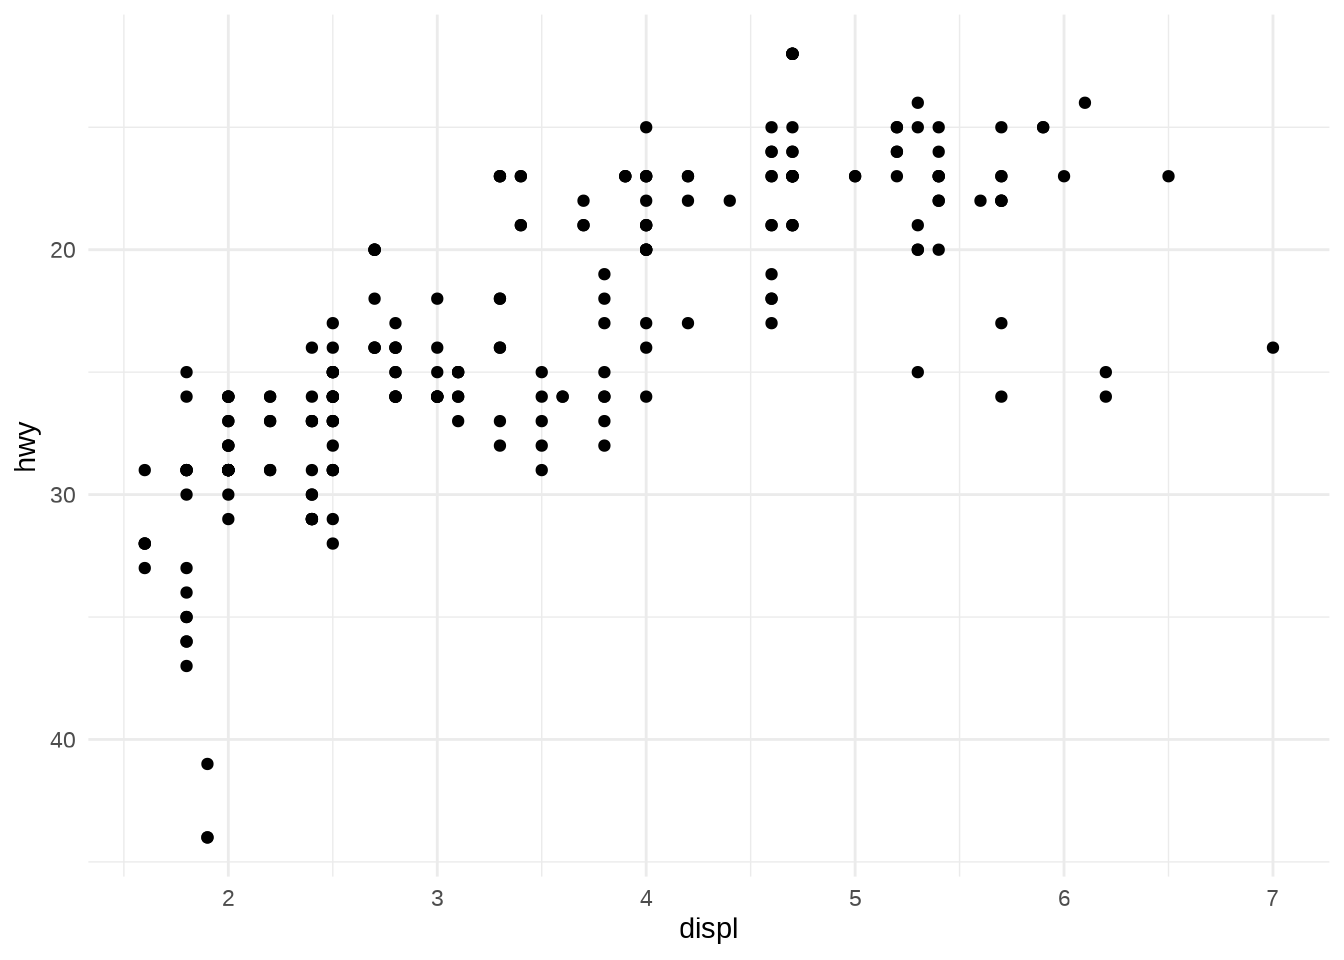
- Remember you can transform the data manually first and opt not to do the transformation on the axes.
- The appearance of the geom will be the same, but the tick labels will be different.
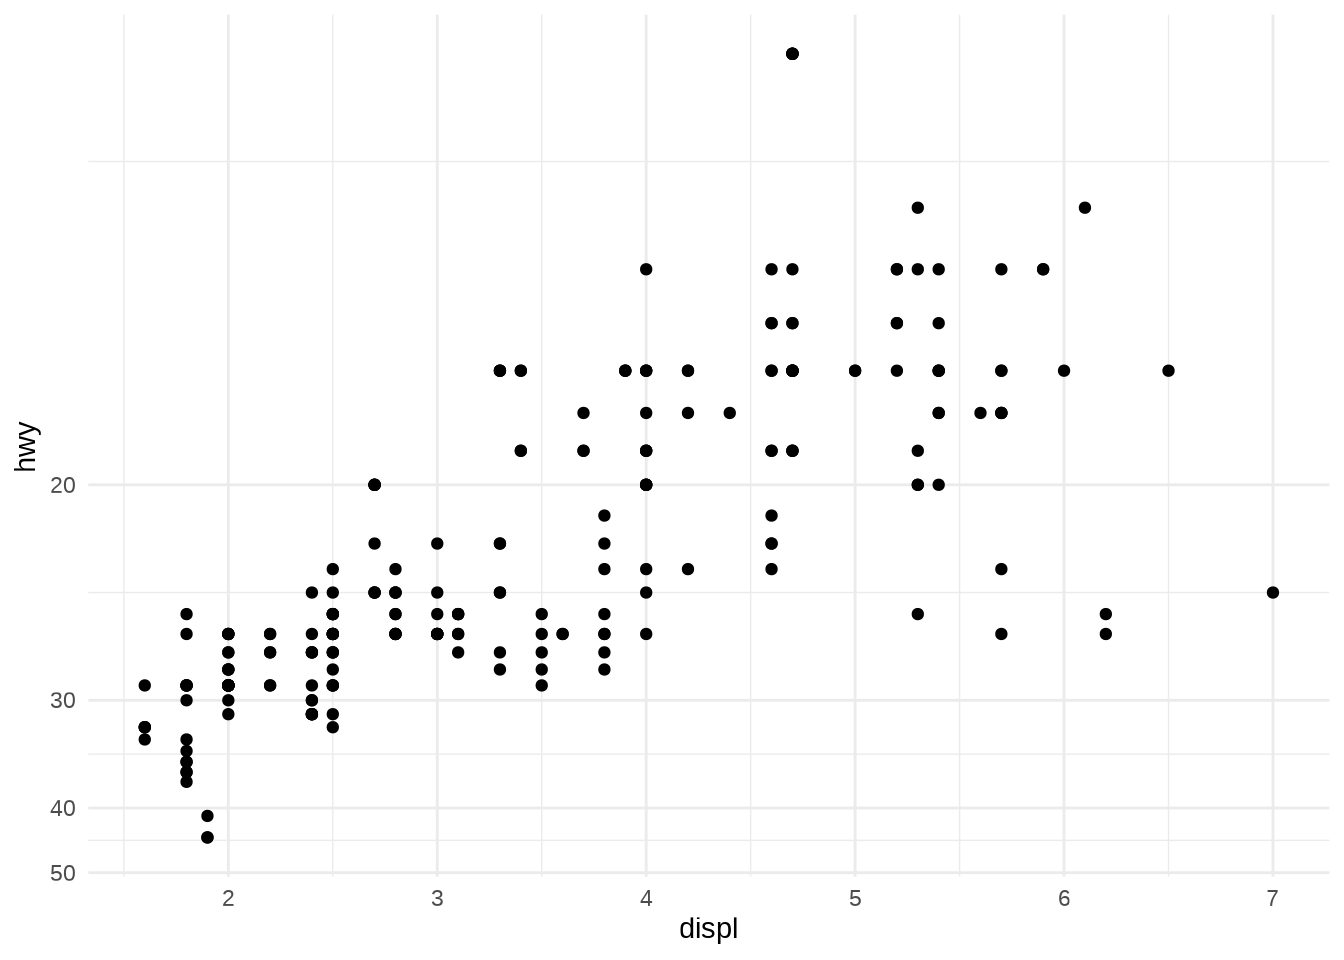
- If you transform the data, the axes will be labelled in the transformed space.
- If you use a transformed scale, the axes will be labelled in the original data space.
- Regardless of which method you use, the transformation occurs before any statistical summaries. To transform after statistical computation use
coord_trans().