13.4 Geoms
geoms stands for geometric objects for short. Some geoms requires both x and y while others not, as well as other require more than simply x and y, such as xmax, ymax etc.
If you do geom_ and tab all the available geoms appear in a list for you to choose from.
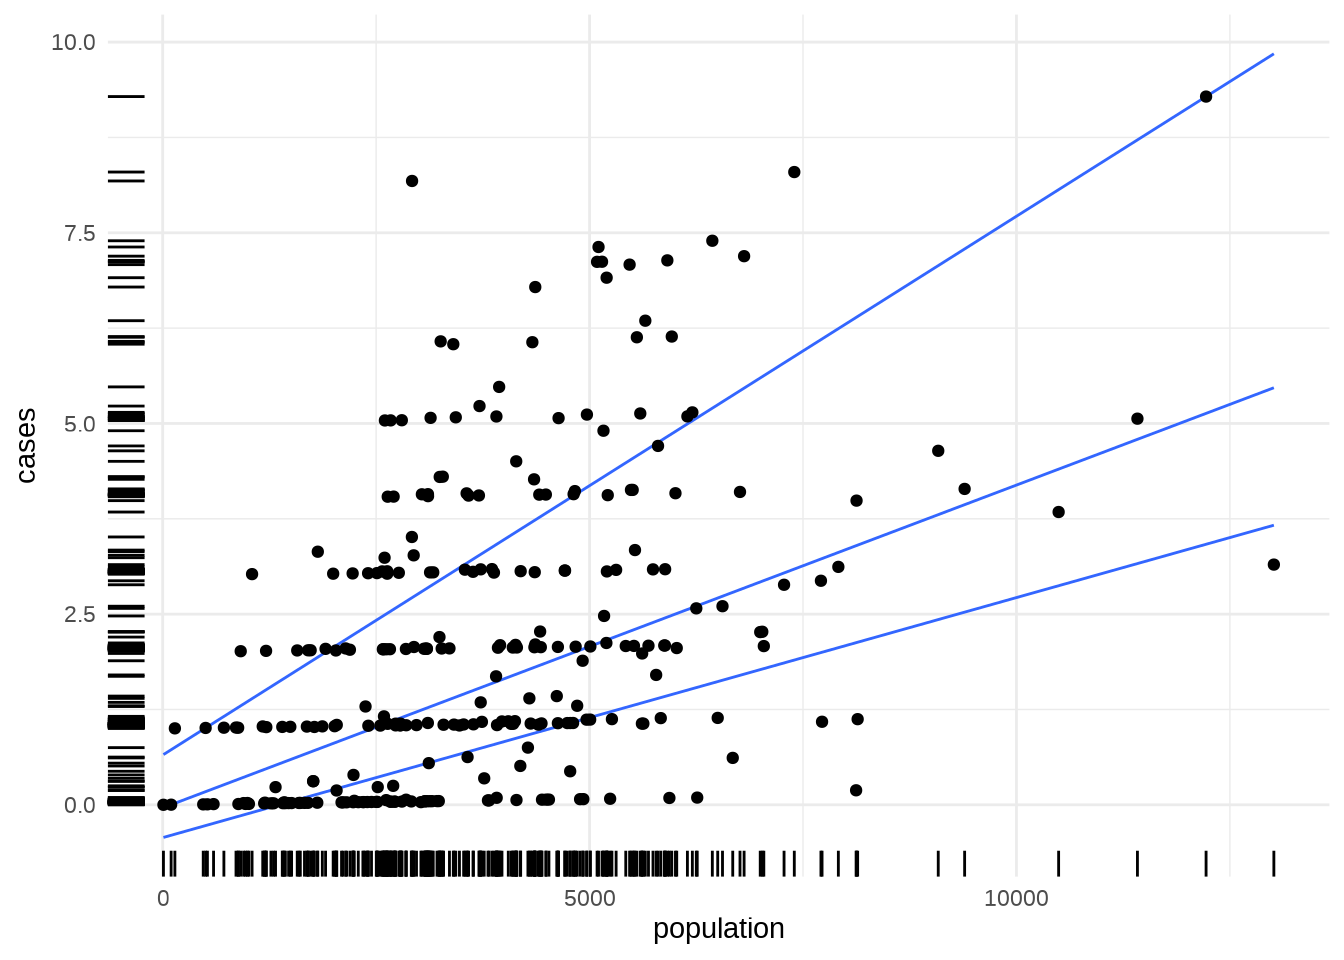
As an example here we use the geom_quantile() to represent a smoothed quantile regression and the geom_rug() for maginal rugs.
13.4.1 Exercises
The book suggests to download the cheatsheets: ggplot2 cheatsheet
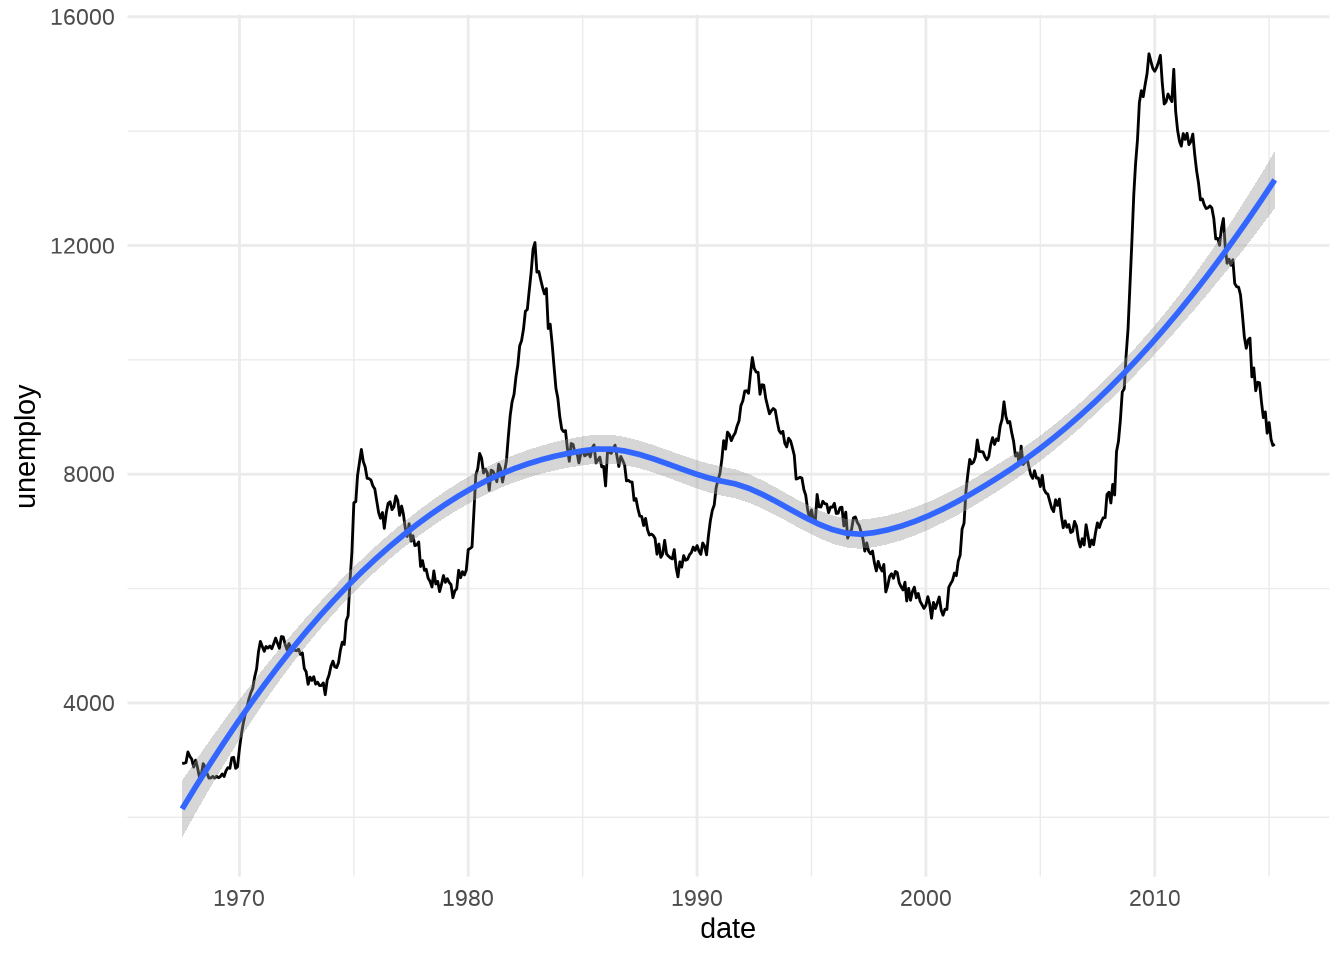
(Ex.5) Display how a variable has changed over time: source
## # A tibble: 3 × 6
##   date         pce    pop psavert uempmed unemploy
##   <date>     <dbl>  <dbl>   <dbl>   <dbl>    <dbl>
## 1 1967-07-01  507. 198712    12.6     4.5     2944
## 2 1967-08-01  510. 198911    12.6     4.7     2945
## 3 1967-09-01  516. 199113    11.9     4.6     2958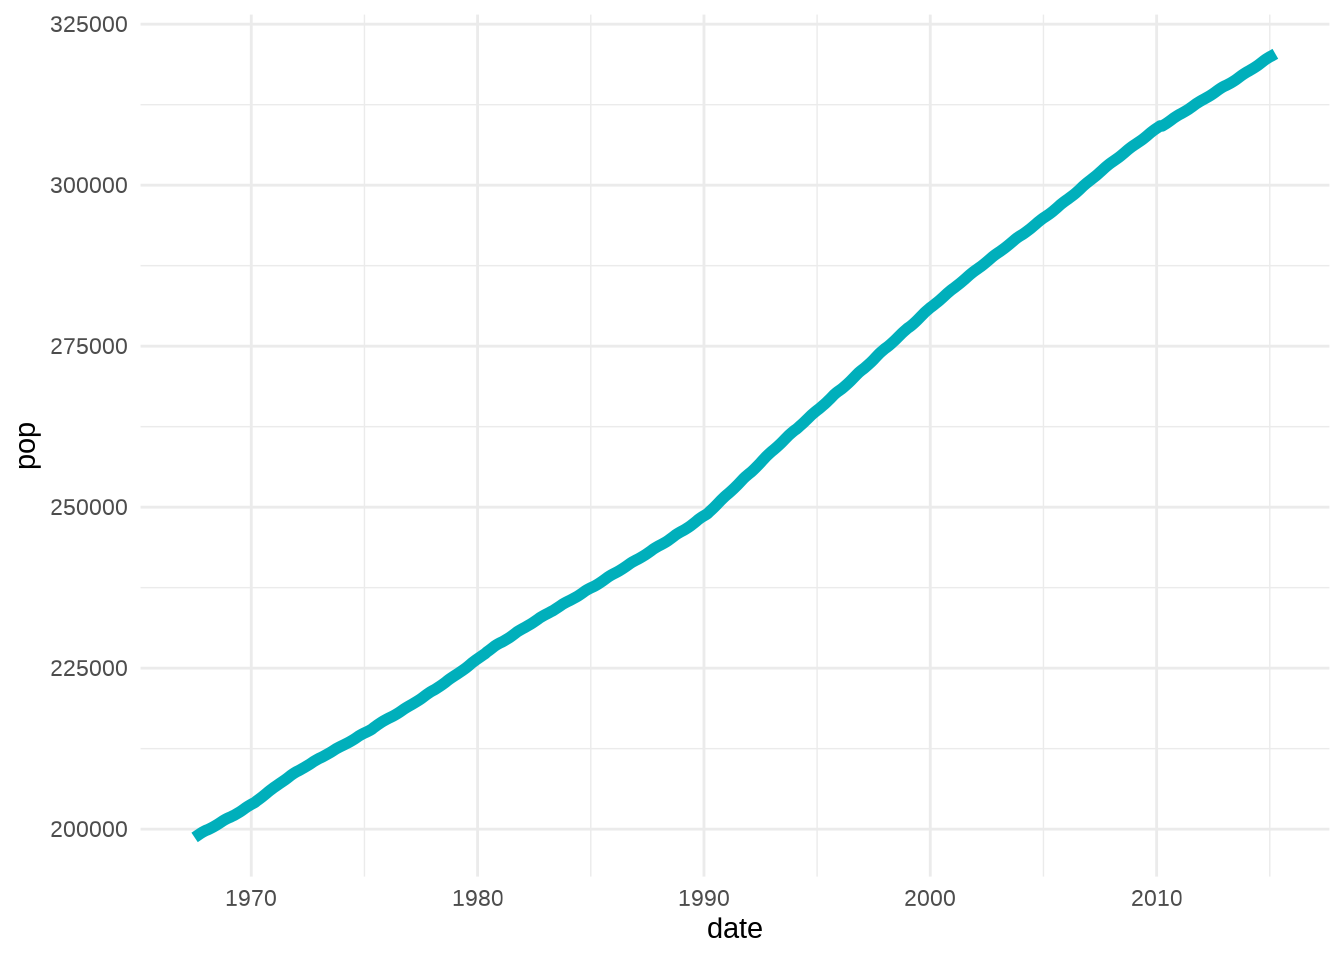
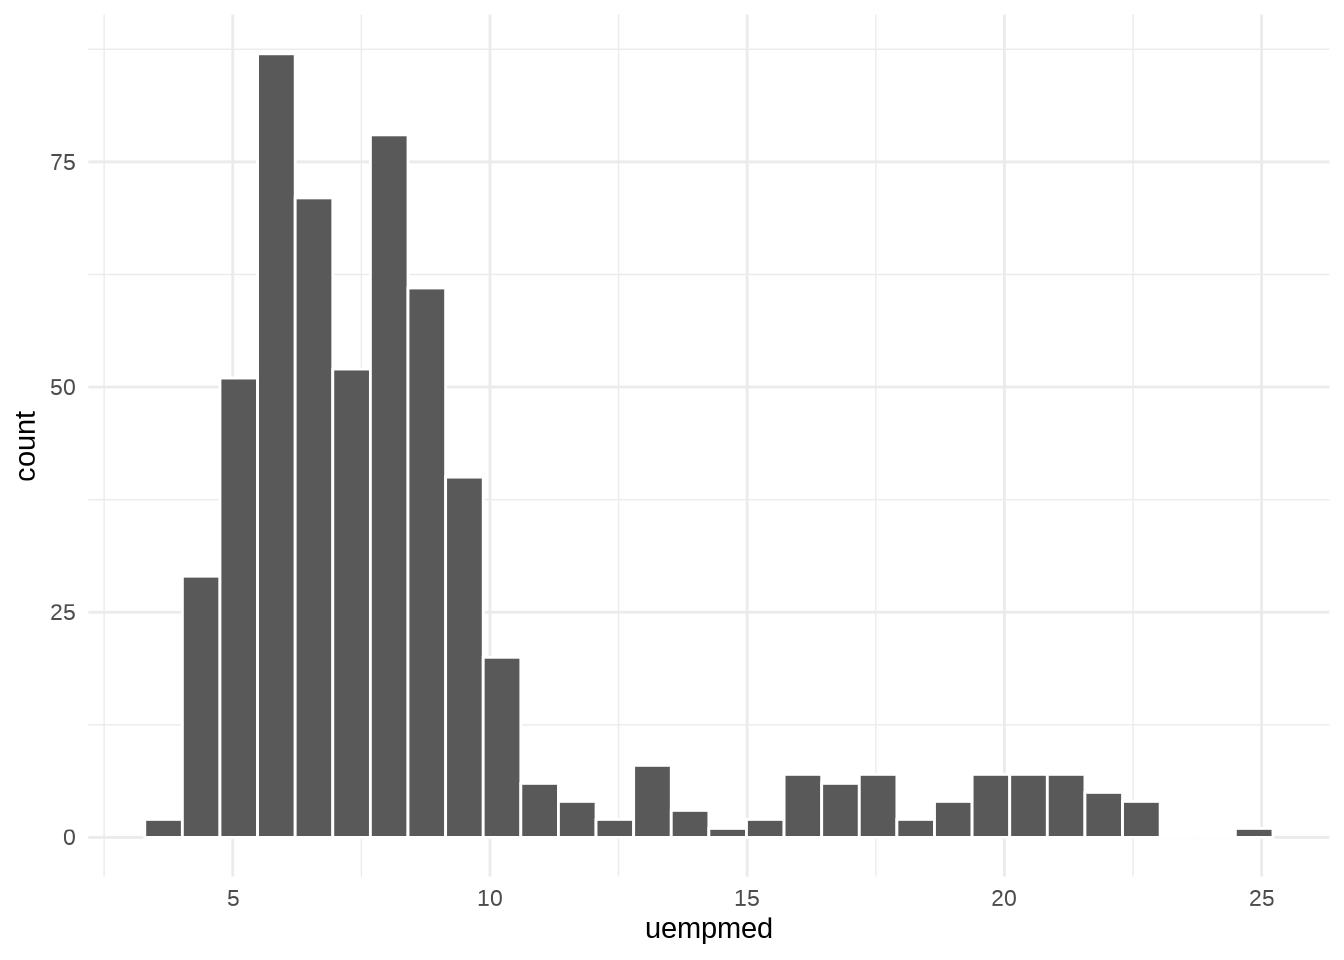
Show the detailed distribution of a single variable The distribution can be described using a frequency table and histogram.
Focus attention on the overall trend in a large dataset
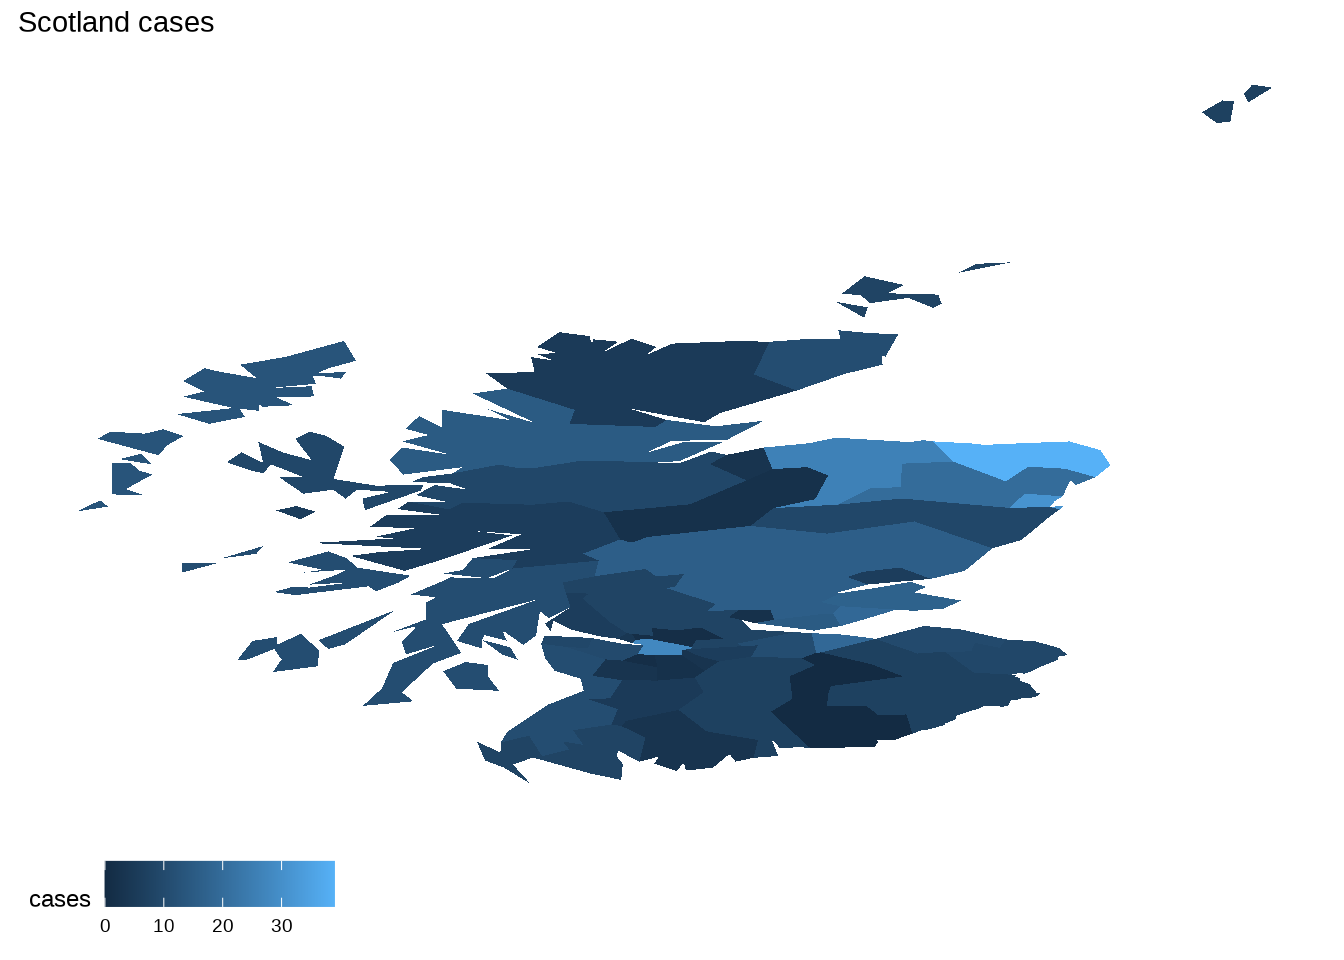
Draw a map
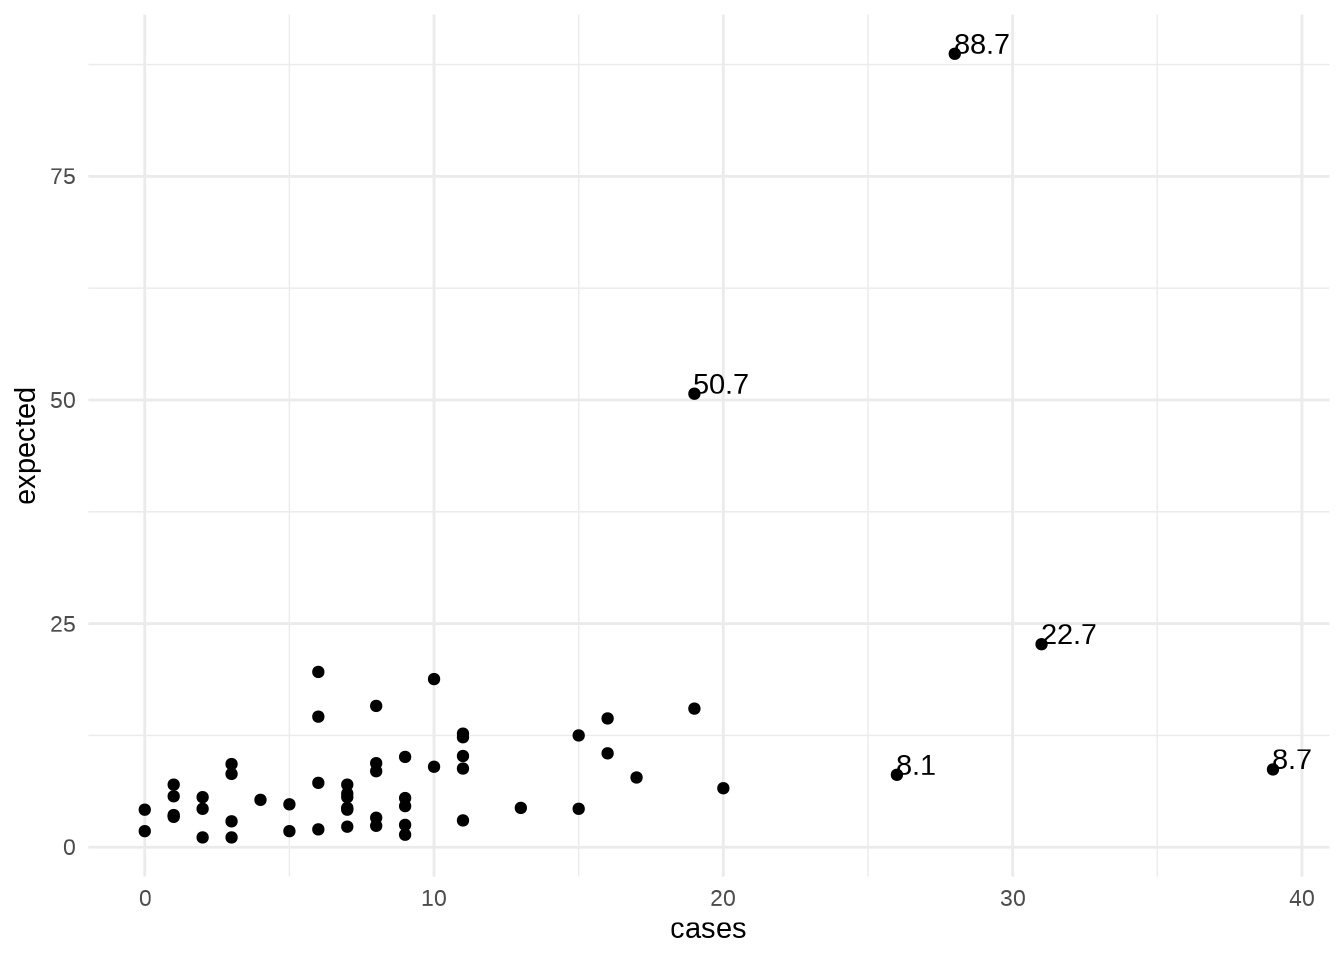
Label outlying points
