20.2 Themes
How about creating new theme elements?
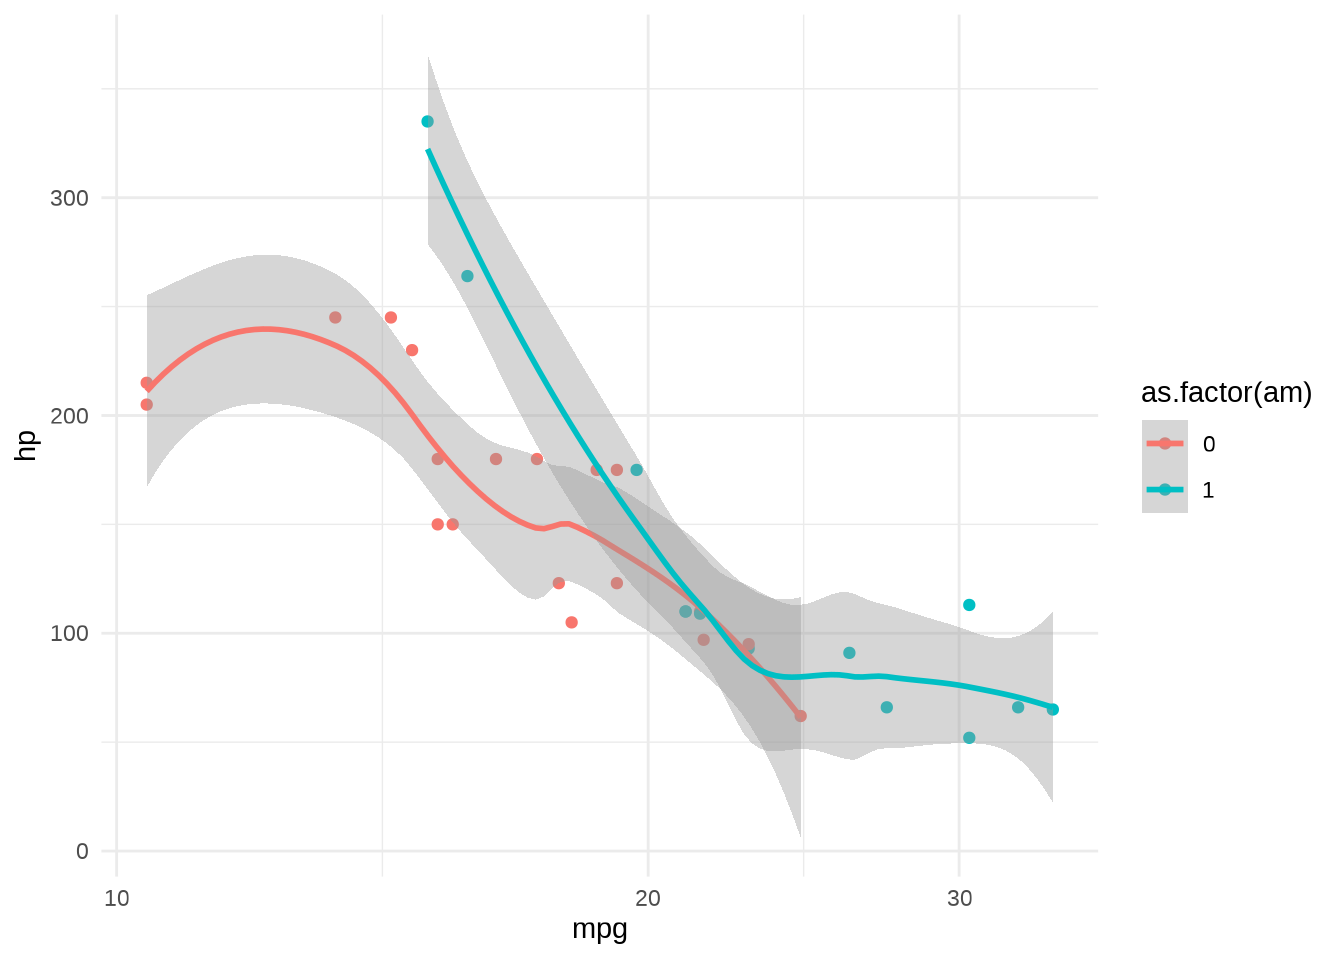
The base is theme is theme_grey(), then here is an example of the modification made on theme_bw() to obtain theme_minimal().
The theme_* is the easiest part of a plot to be modified.
Use the print() function on a theme_<…> to see its specifications, the %+replace% operator shows where the substitutions have taken place.
print(theme_grey)
print(theme_minimal) and %+replace% operator
function (base_size = 11, base_family = "", base_line_size = base_size/22,
    base_rect_size = base_size/22)
{
    theme_grey(base_size = base_size, base_family = base_family,
        base_line_size = base_line_size, base_rect_size = base_rect_size) %+replace%
        theme(panel.background = element_rect(fill = "white",
            colour = NA), panel.border = element_rect(fill = NA,
            colour = "grey20"), panel.grid = element_line(colour = "grey92"),
            panel.grid.minor = element_line(linewidth = rel(0.5)),
            strip.background = element_rect(fill = "grey85",
                colour = "grey20"), complete = TRUE)
}
<bytecode: 0x564f9e732710>
<environment: namespace:ggplot2>function (base_size = 11, base_family = "", base_line_size = base_size/22,
base_rect_size = base_size/22)
{
theme_bw(base_size = base_size, base_family = base_family,
base_line_size = base_line_size, base_rect_size = base_rect_size) %+replace%
theme(axis.ticks = element_blank(), legend.background = element_blank(),
legend.key = element_blank(), panel.background = element_blank(),
panel.border = element_blank(), strip.background = element_blank(),
plot.background = element_blank(), complete = TRUE)
}
<bytecode: 0x564fa3444d38>
<environment: namespace:ggplot2>While if we call the function: print(theme_minimal()), we can see all the options set available.
In general, if you want to make a modification to an existing theme, the general approach is to simply use the theme() function while setting complete = TRUE.