12.2 Shape
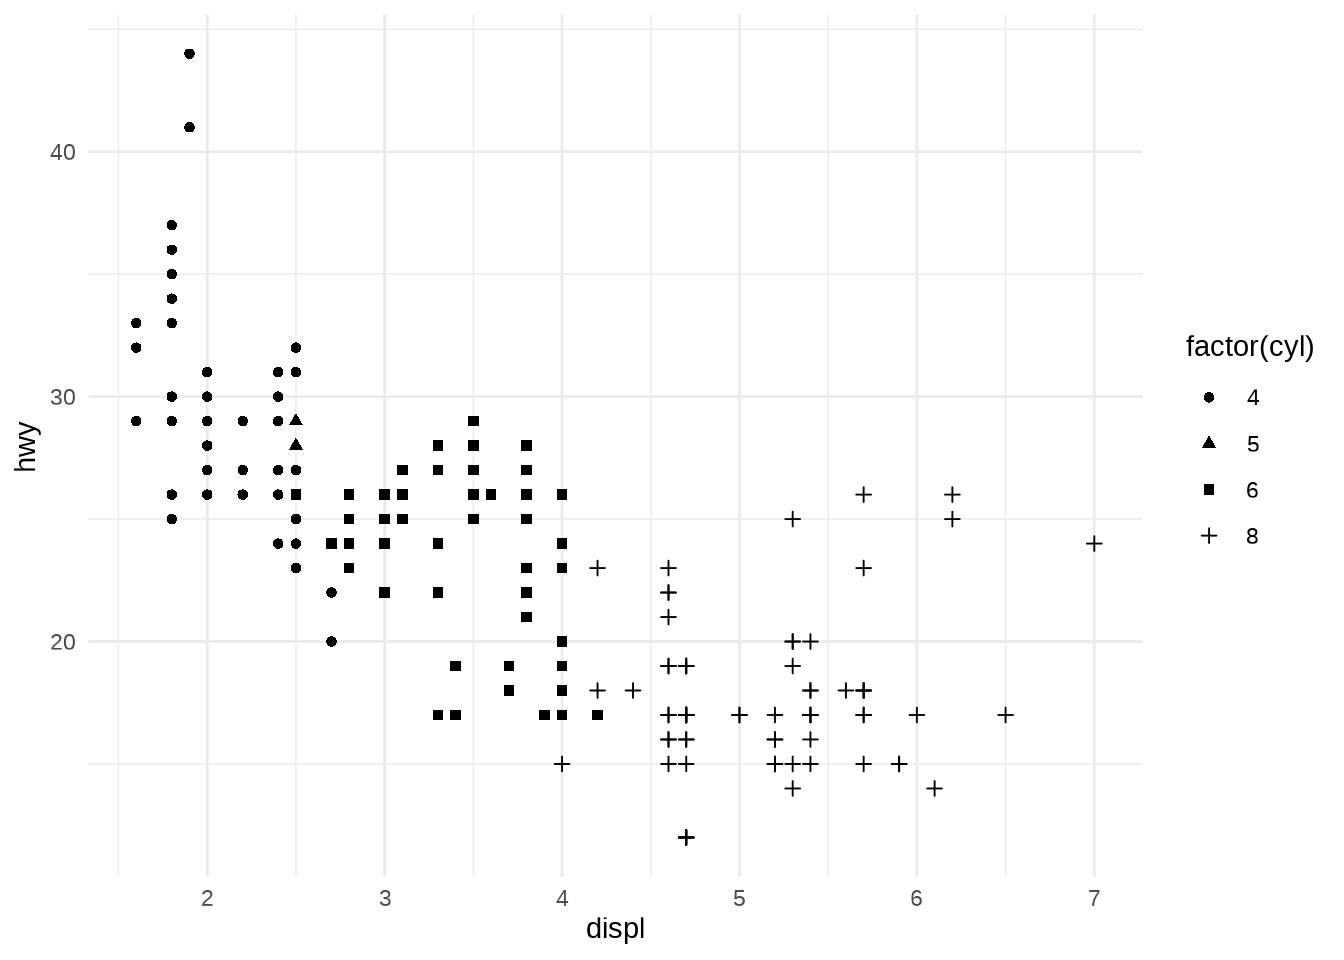
Values can be mapped to the shape aesthetic, most typically when you have a small number of discrete categories.
Note: if the data variable contains more than 6 values it becomes difficult to distinguish between shapes, and will produce a warning. Although any one plot is unlikely to be readable with more than a 6 distinct markers, there are 25 possible shapes to choose from.
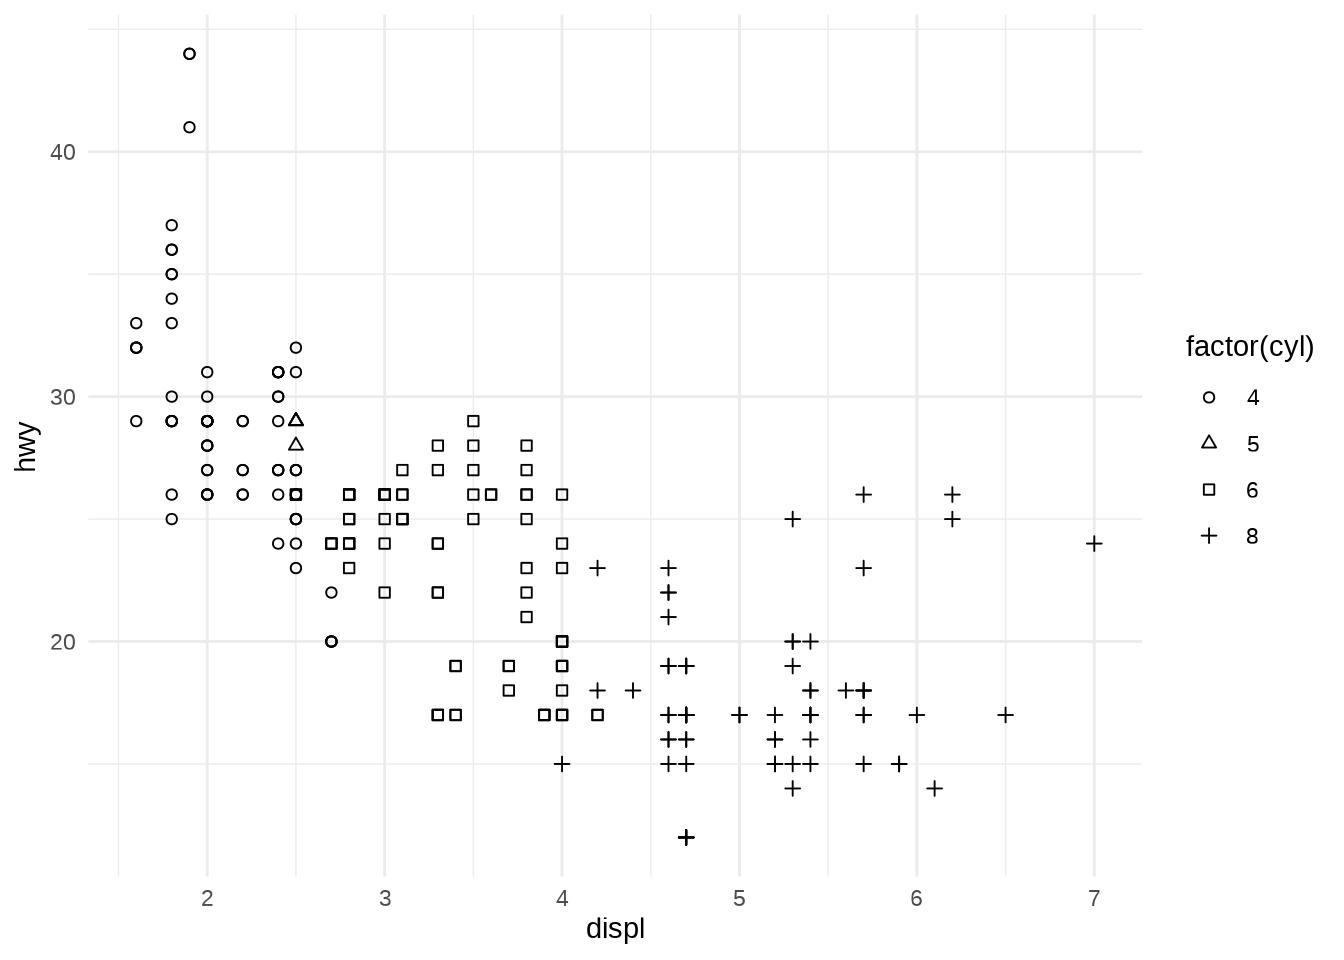
The default scale_shape() function contains a single argument: set solid = TRUE (the default) to use a “palette” consisting of three solid shapes and three hollow shapes, or set solid = FALSE to use six hollow shapes:


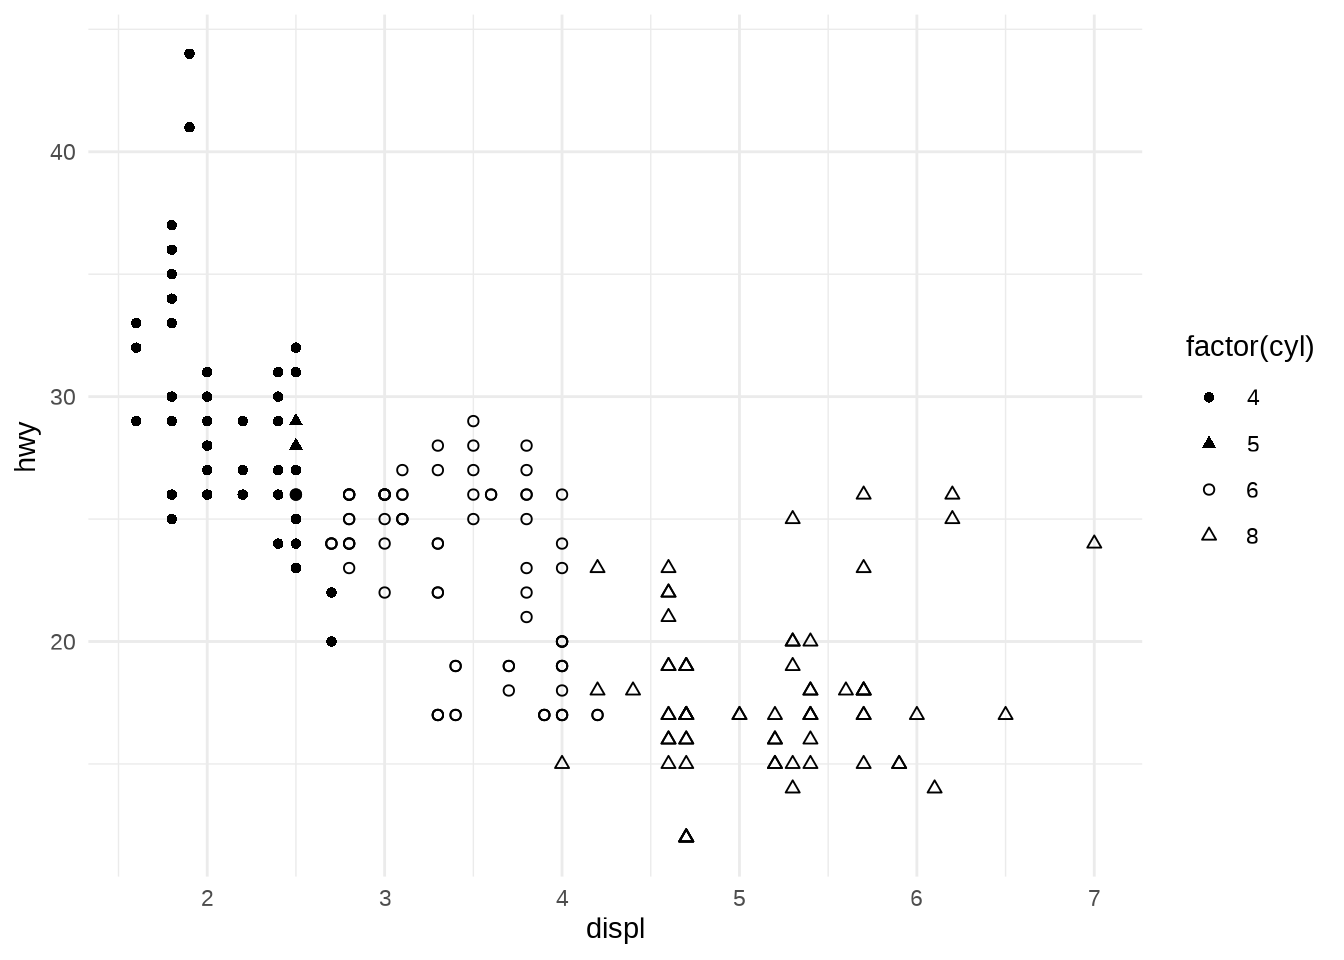
- You can specify the marker types for each data value manually using scale_shape_manual(). For more information about manual scales see Section 12.4.
