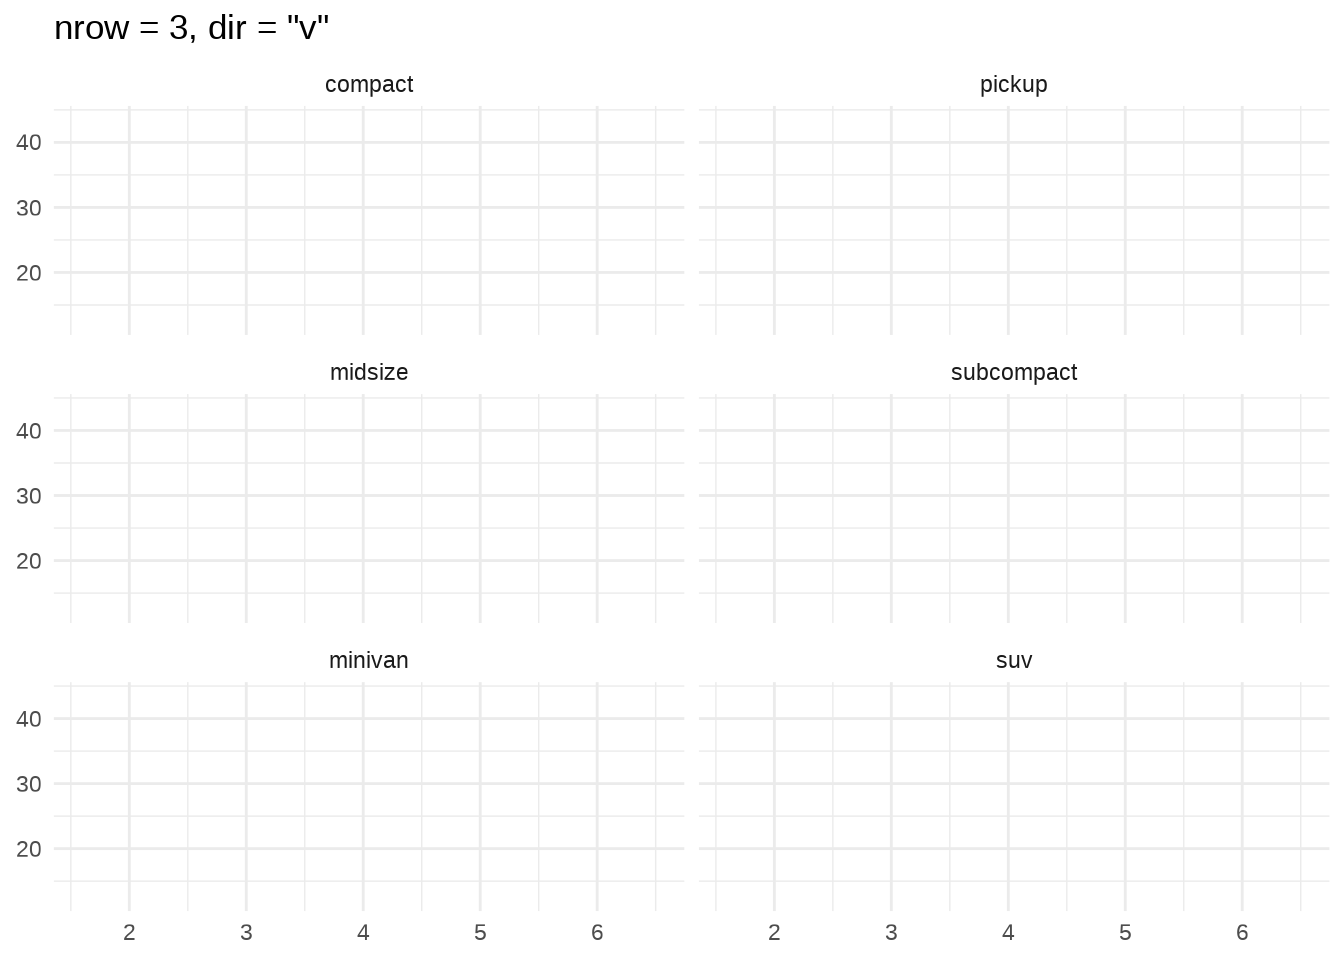
16.2 Facet wrap
Useful if you have a single variable with many levels and want to arrange the plots in a spatially efficient way. For example, if you have multiple individuals within a study.
Useful arguments:
ncolandnrowcontrol how many columns or rows, respectively. Only one of these needs to be set.as.tablecontrols whether the facets are laid out like a table (TRUE, the default), with highest values at the bottom-right, or a plot (FALSE), with the highest values at the top-right.dircontrols the direction of wrap: horizontal ("h") or vertical ("v").
# A tibble: 6 × 2
  class          n
  <chr>      <int>
1 compact       45
2 midsize       41
3 minivan       11
4 pickup        33
5 subcompact    24
6 suv           51