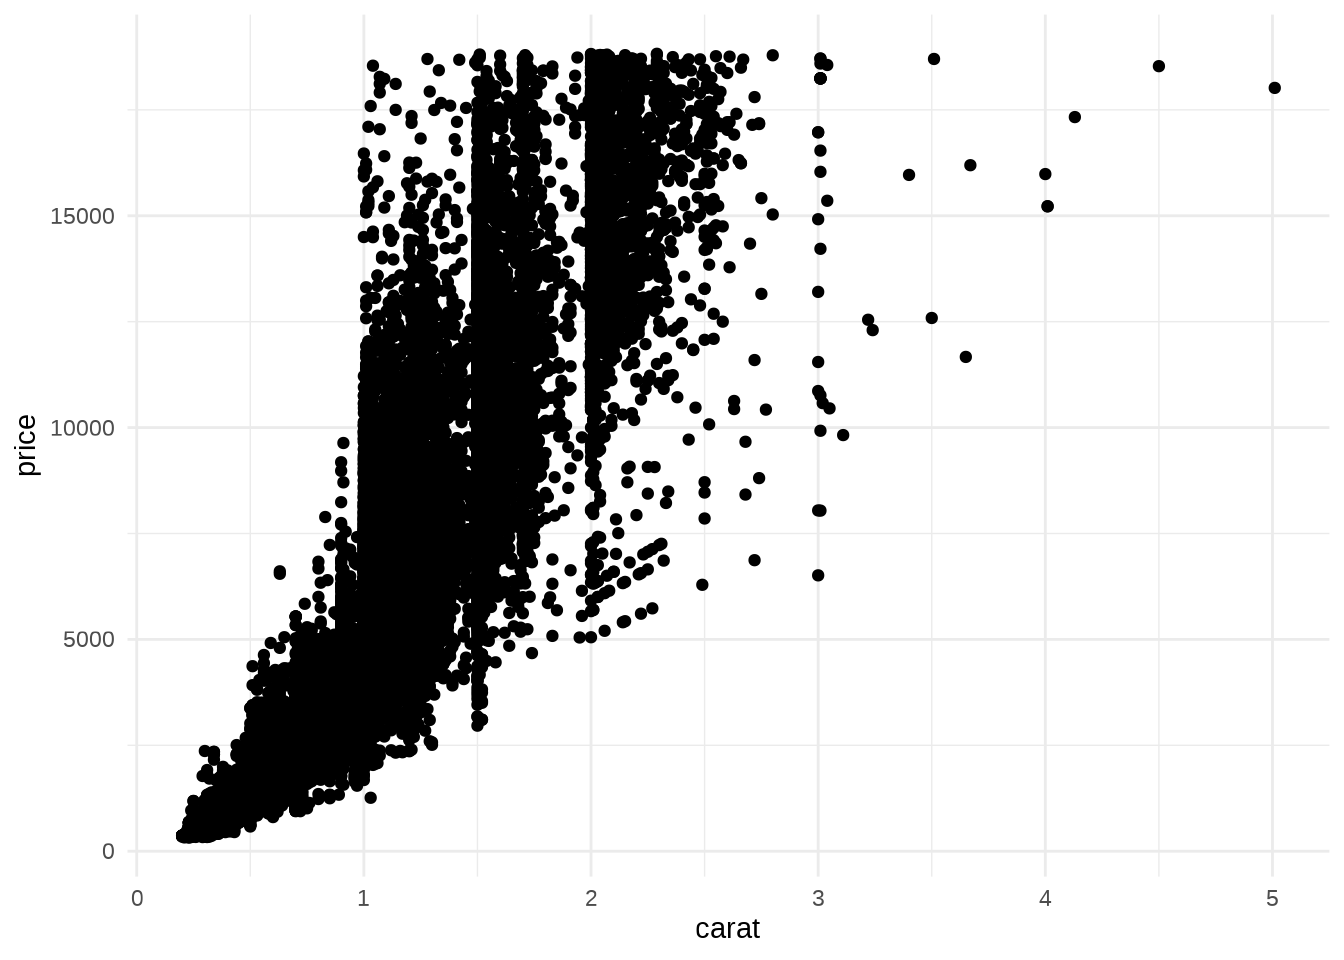
Building a scatterplot
ggplot(mpg, aes(displ, hwy, colour = factor(cyl))) +
  geom_line() +
  theme(legend.position = "none")
ggplot(mpg, aes(displ, hwy, colour = factor(cyl))) +
  geom_bar(stat = "identity", position = "identity", fill = NA) +
  theme(legend.position = "none")
ggplot(mpg, aes(displ, hwy, colour = factor(cyl))) +
  geom_point() +
  geom_smooth(method = "lm") +
  labs(title = "What type of graph would you call this?", subtitle = "Notice the defaults of ggplot2") +
  theme(plot.title = element_text(size = 15, color =
                                    "firebrick", face = "bold", hjust = .5))   +
  theme(plot.subtitle = element_text(hjust = .5))
