Exercise 3
- What low-level geoms are used to draw geom_smooth()?
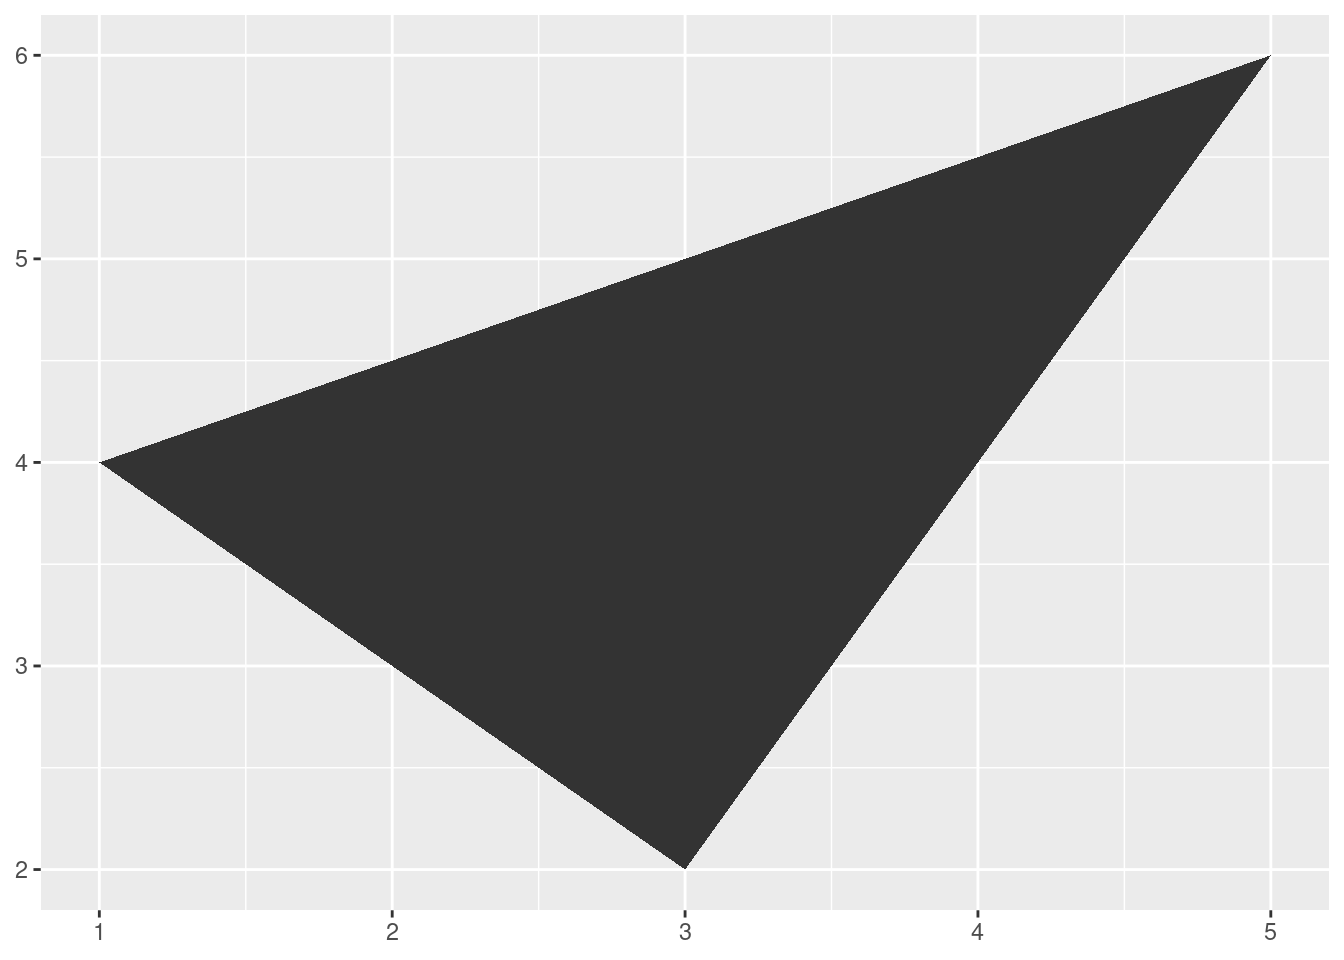
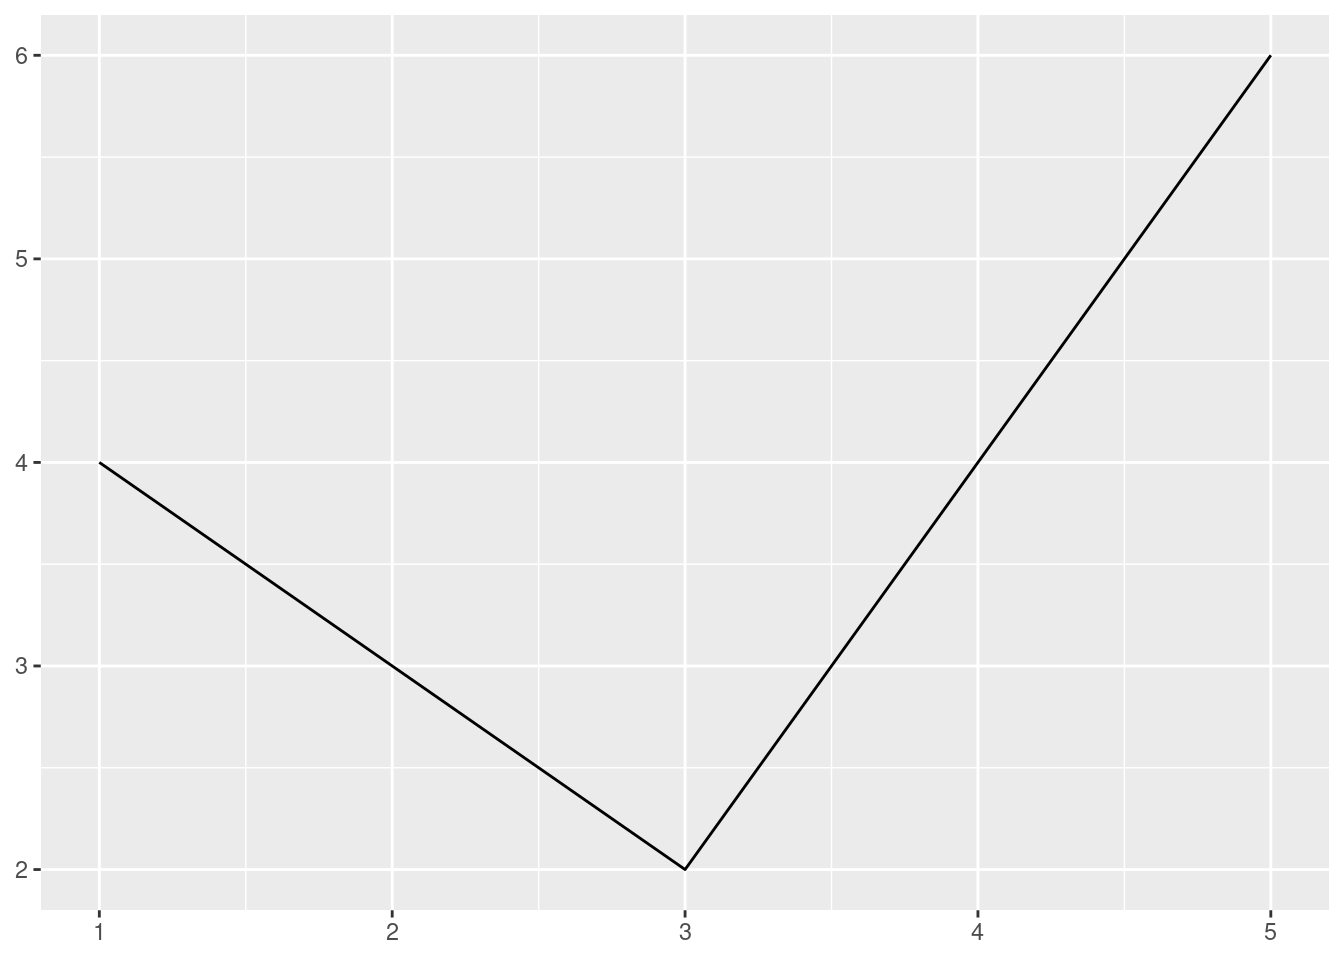
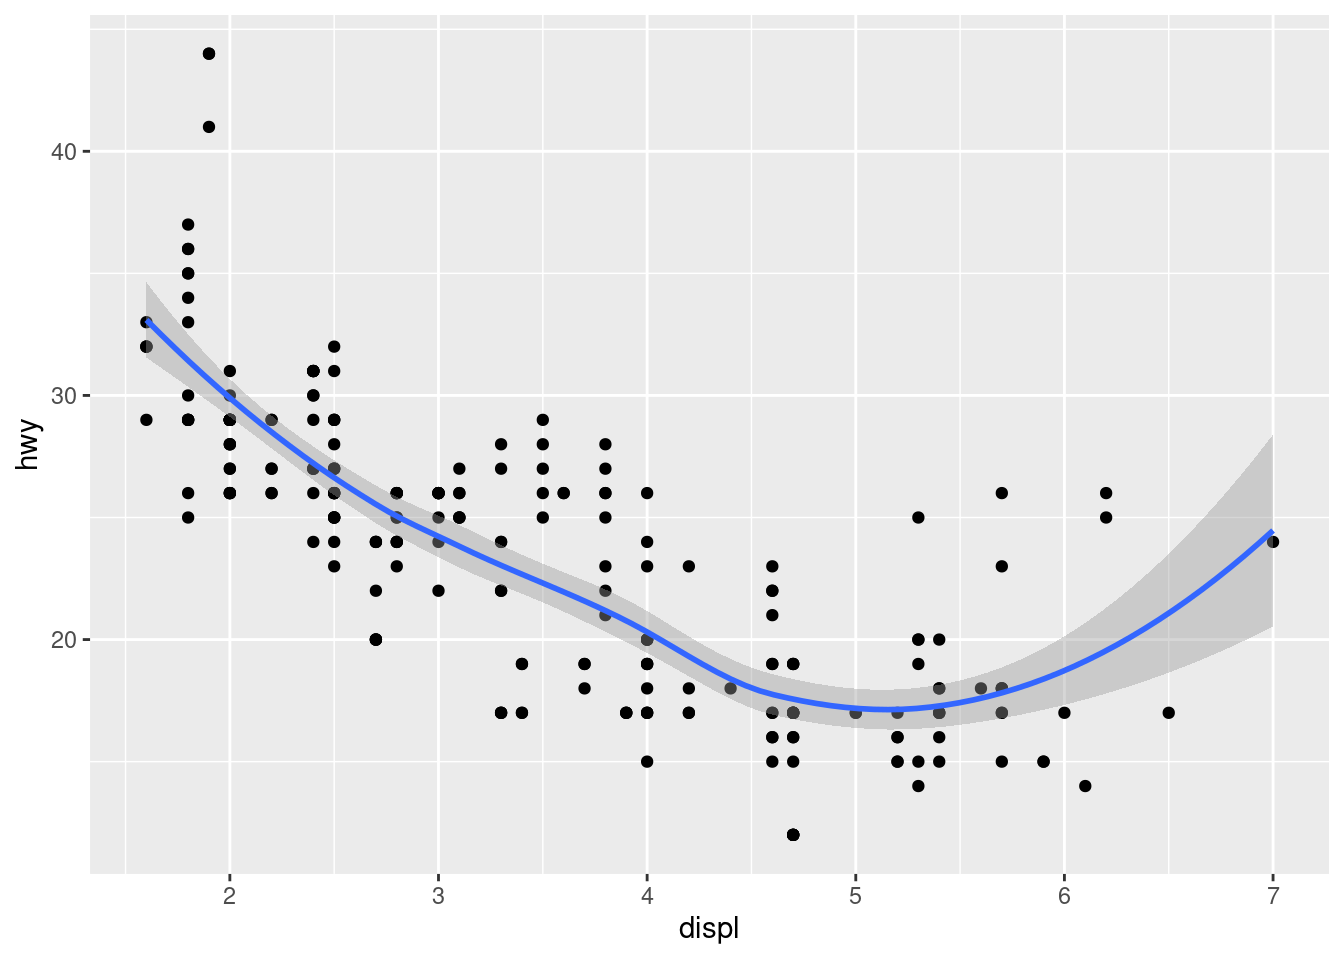
geom_smooth() fits a smoother to data, displaying the smooth and its standard error, allowing you to see a dominant pattern within a scatterplot with a lot of “noise”. The low level geom for geom_smooth() are geom_path(), geom_area() and geom_point().
ggplot(mpg, aes(displ, hwy)) +
  geom_point() +
  geom_smooth()
## `geom_smooth()` using method = 'loess' and formula = 'y ~ x'
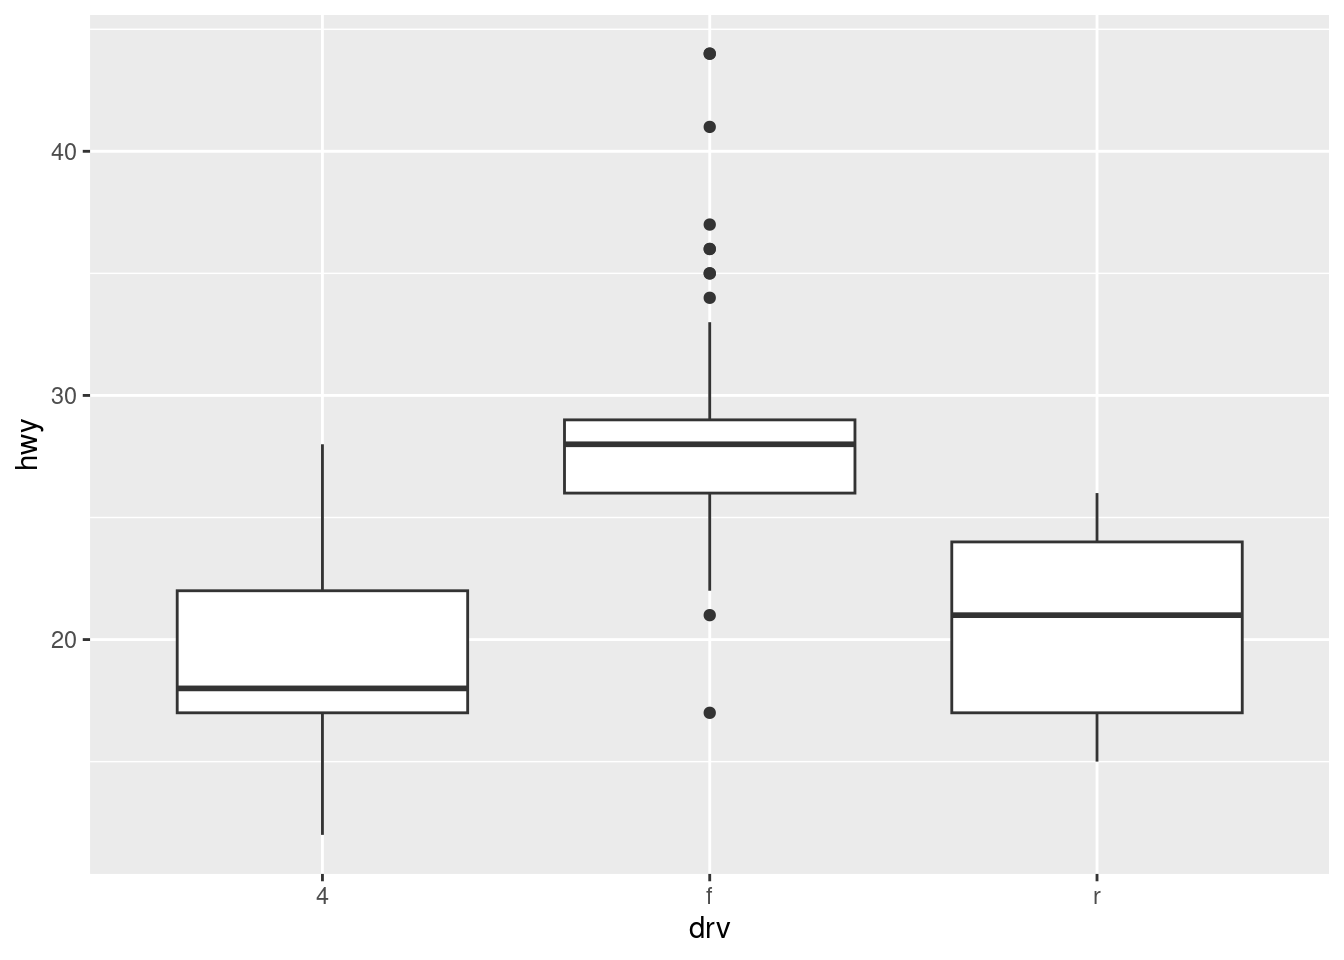
- What low-level geoms are used to draw geom_boxplot()?
- Box plots are used to summarize the distribution of a set of points using summary statistics. The low level geom for
geom_boxplot() are geom_rect(), geom_line() and geom_point().
ggplot(mpg, aes(drv, hwy)) +
  geom_boxplot()
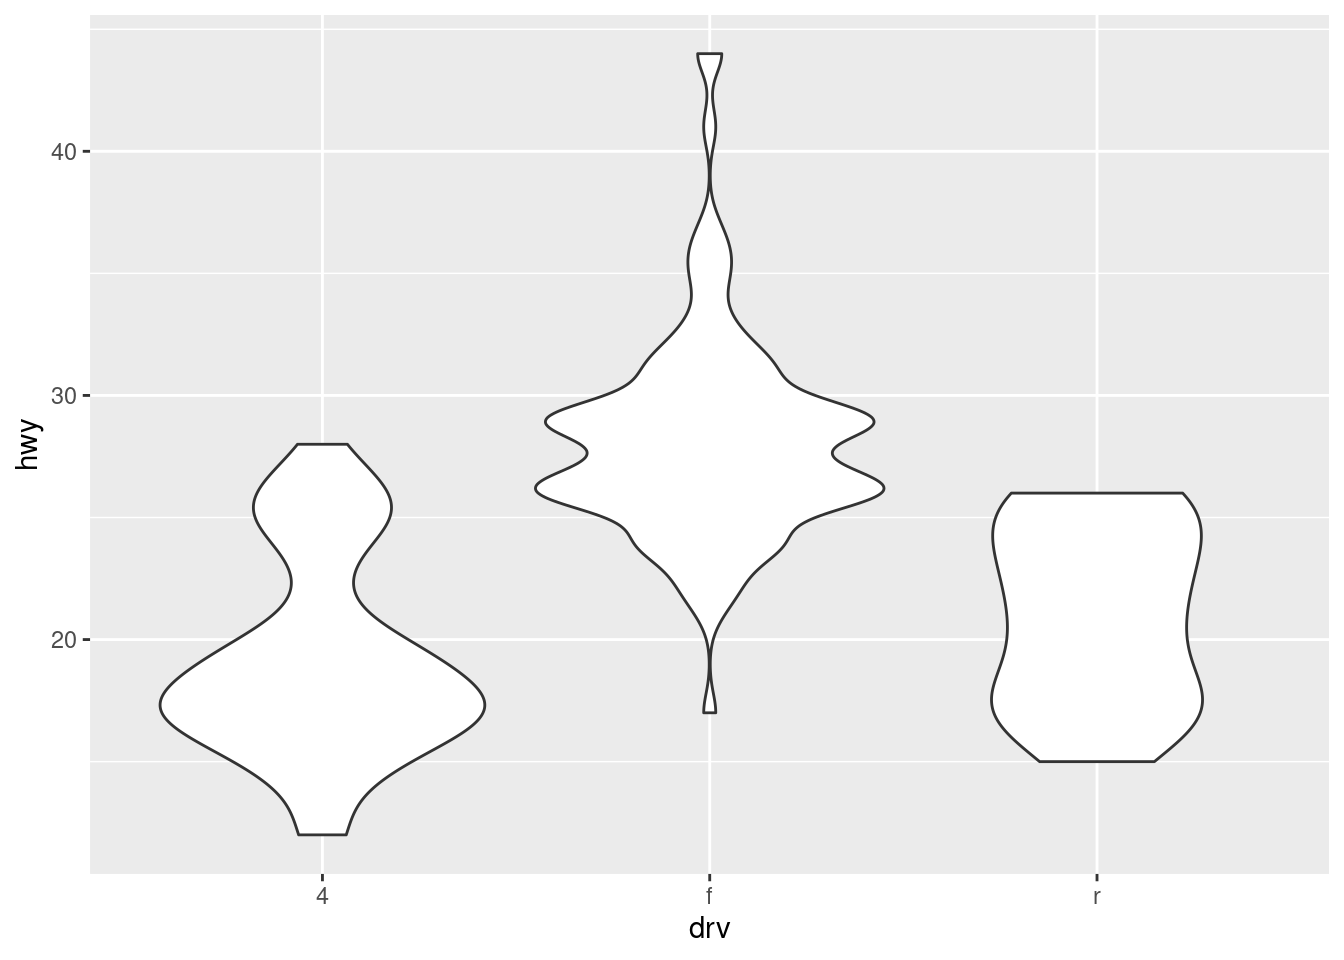
- What low-level geoms are used to draw geom_violin()?
- Violin plots show a compact representation of the density of the distribution highlighting the areas where most of the points are found. The low level geom for
geom_violin() are geom_area() and geom_path().
ggplot(mpg, aes(drv, hwy)) +
  geom_violin()