14.5 Scale transformation
The most common use for scale transformations is to adjust a continuous position scale, as discussed in Section 10.1.7. However, they can sometimes be helpful to when applied to other aesthetics. Often this is purely a matter of visual emphasis.
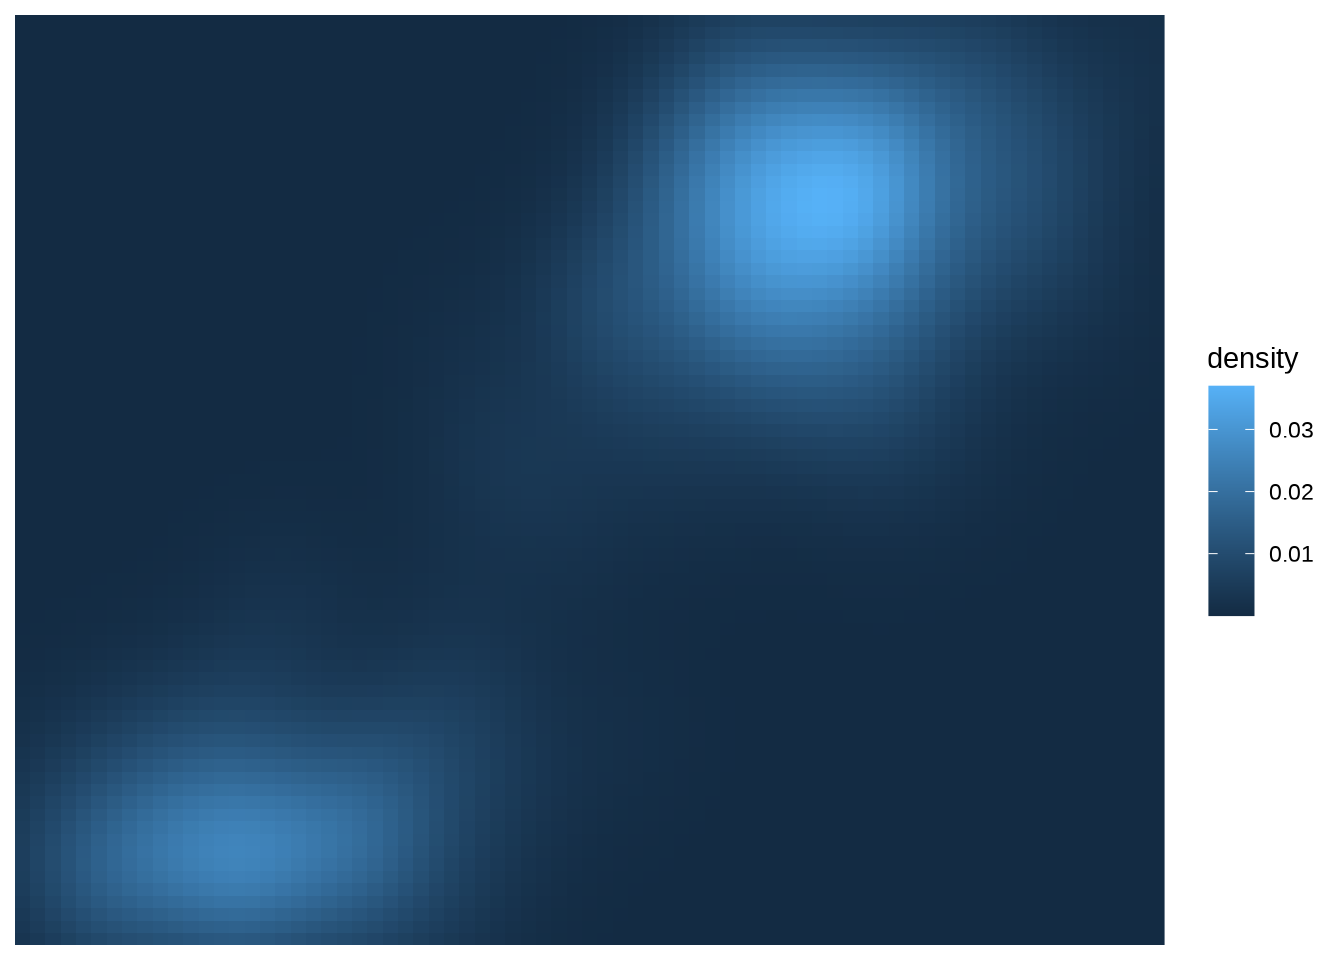
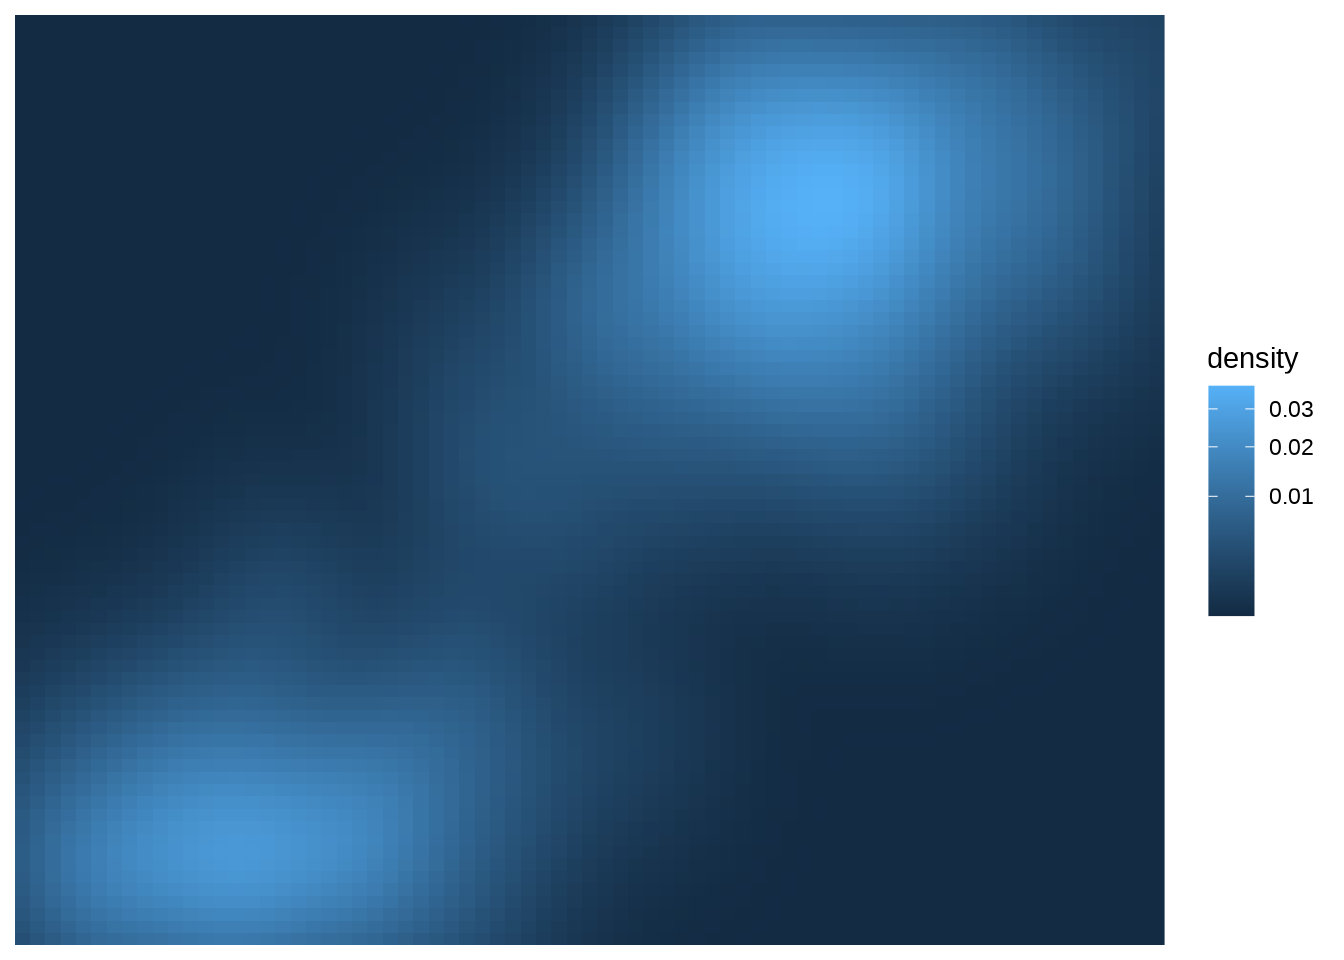
An example of this for the Old Faithful density plot is shown below. The linearly mapped scale on the left makes it easy to see the peaks of the distribution, whereas the transformed representation on the right makes it easier to see the regions of non-negligible density around those peaks:


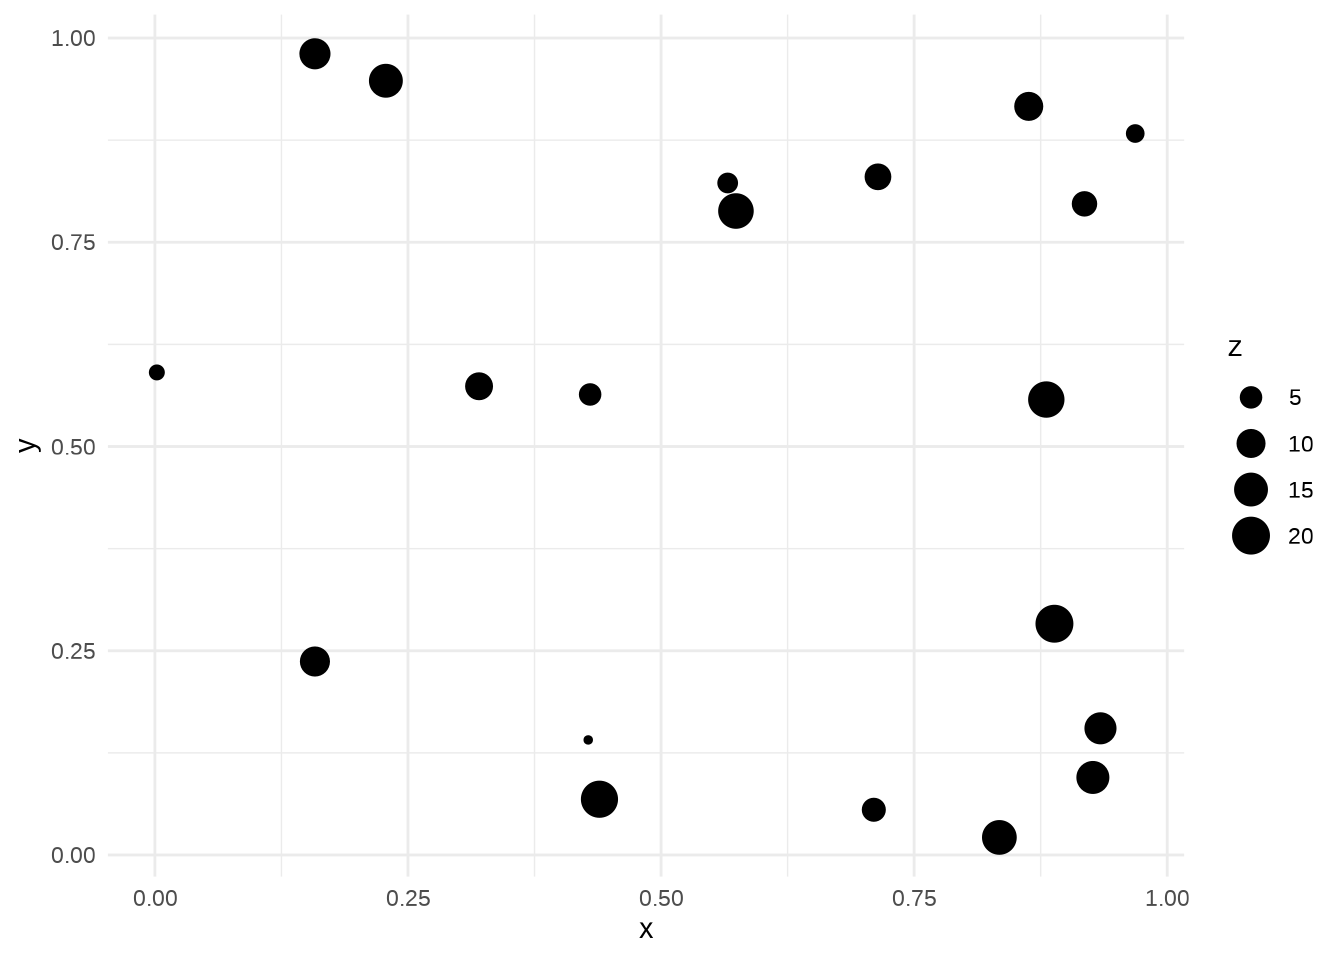
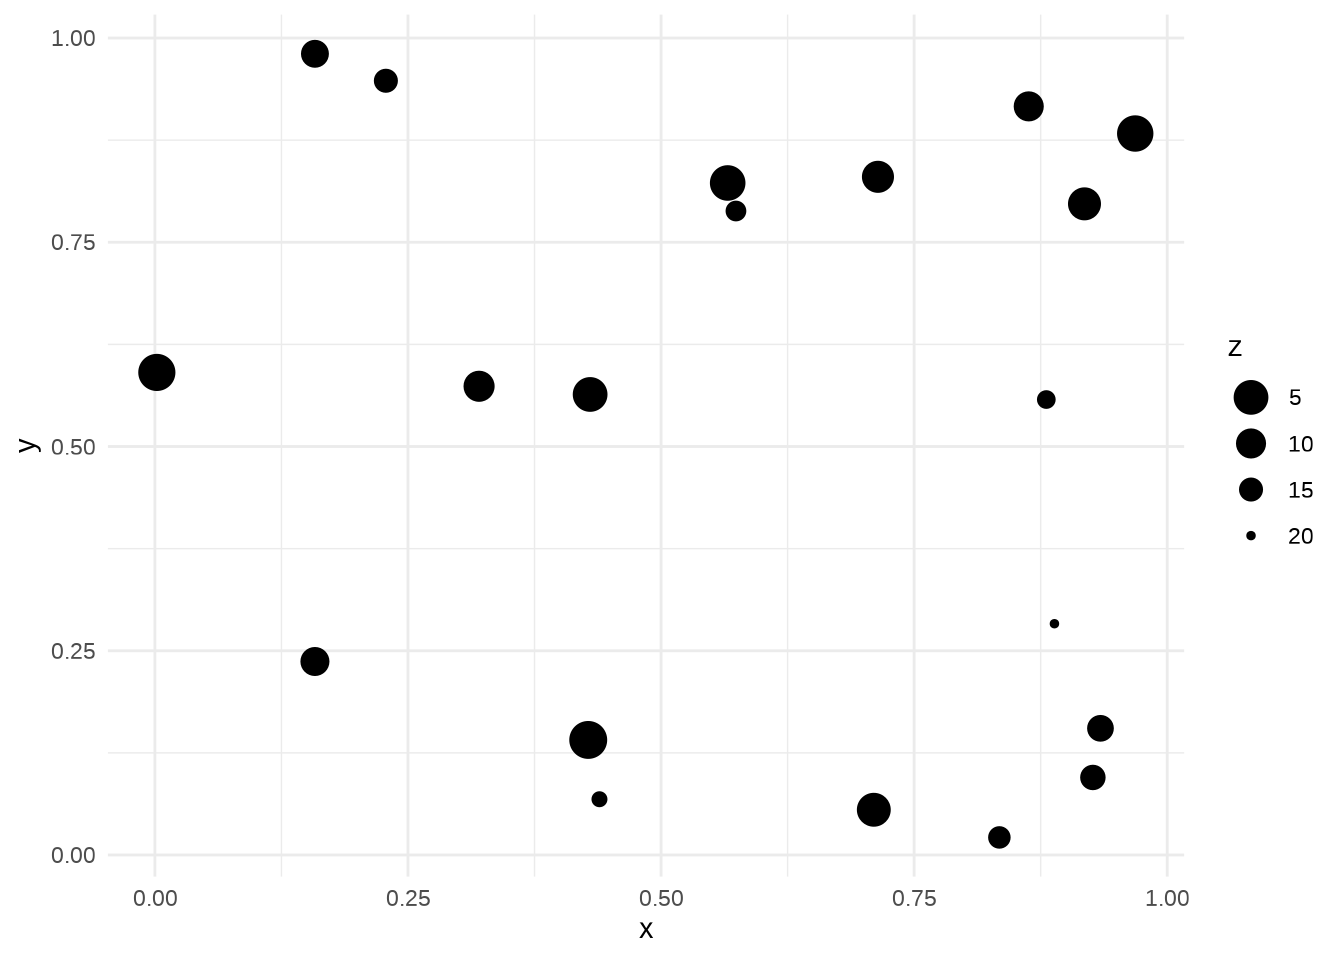
Transforming size aesthetics is also possible:


In the plot on the left, the z value is naturally interpreted as a “weight”: if each dot corresponds to a group, the z value might be the size of the group. In the plot on the right, the size scale is reversed, and z is more naturally interpreted as a “distance” measure: distant entities are scaled to appear smaller in the plot.