2.6 Other aesthetic attributes
- color, shape and size can be mapped to variables in the data
The class variable of the mpg dataset has seven unique values. The plot can assign a specific color to each value by mapping class to color within the aesthetic function.
## # A tibble: 7 × 1
##   class
##   <chr>
## 1 compact
## 2 midsize
## 3 suv
## 4 2seater
## 5 minivan
## 6 pickup
## 7 subcompact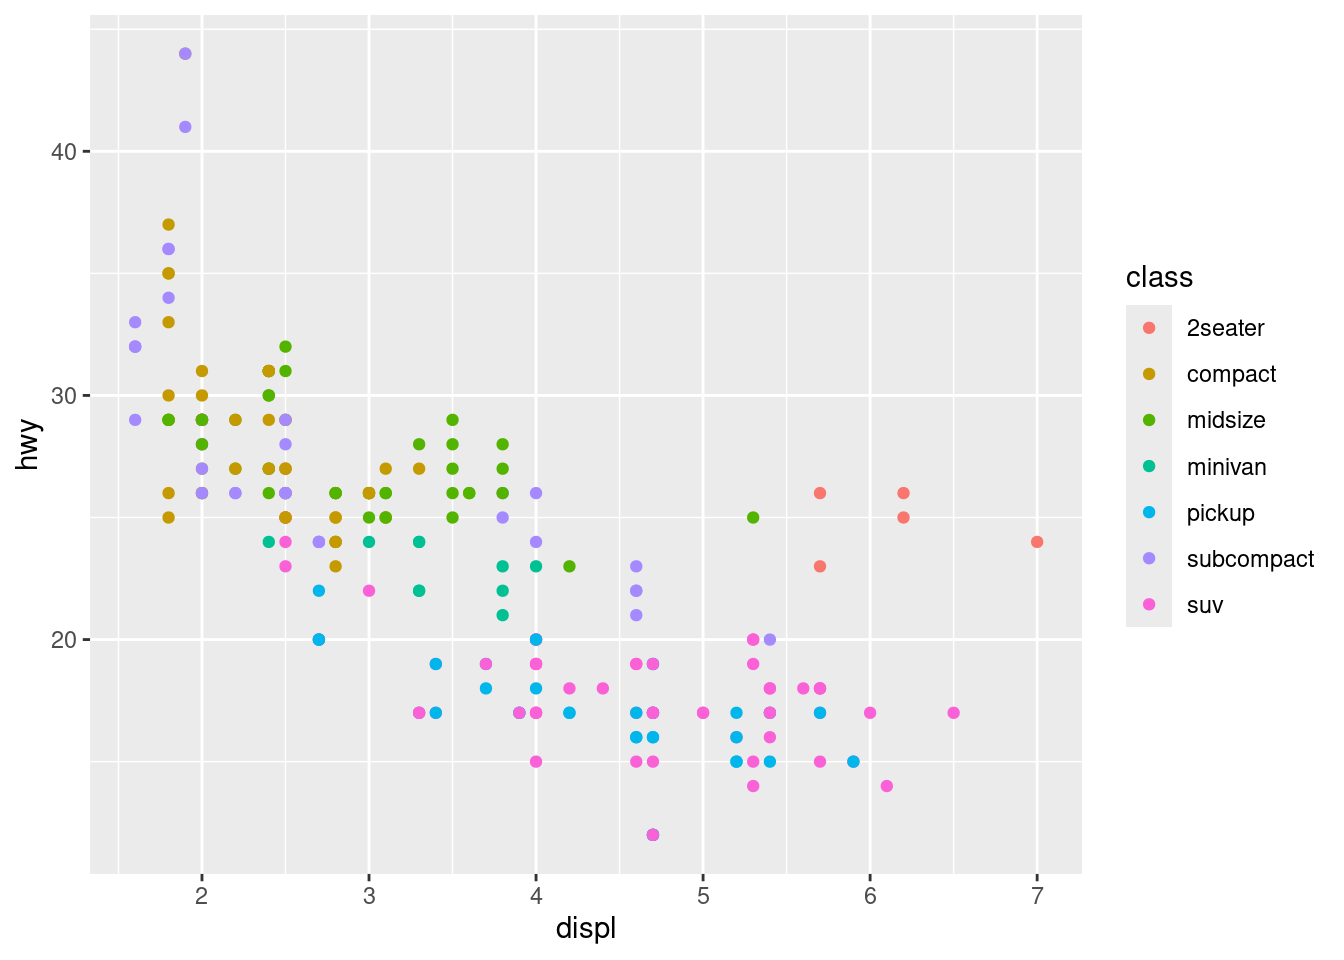
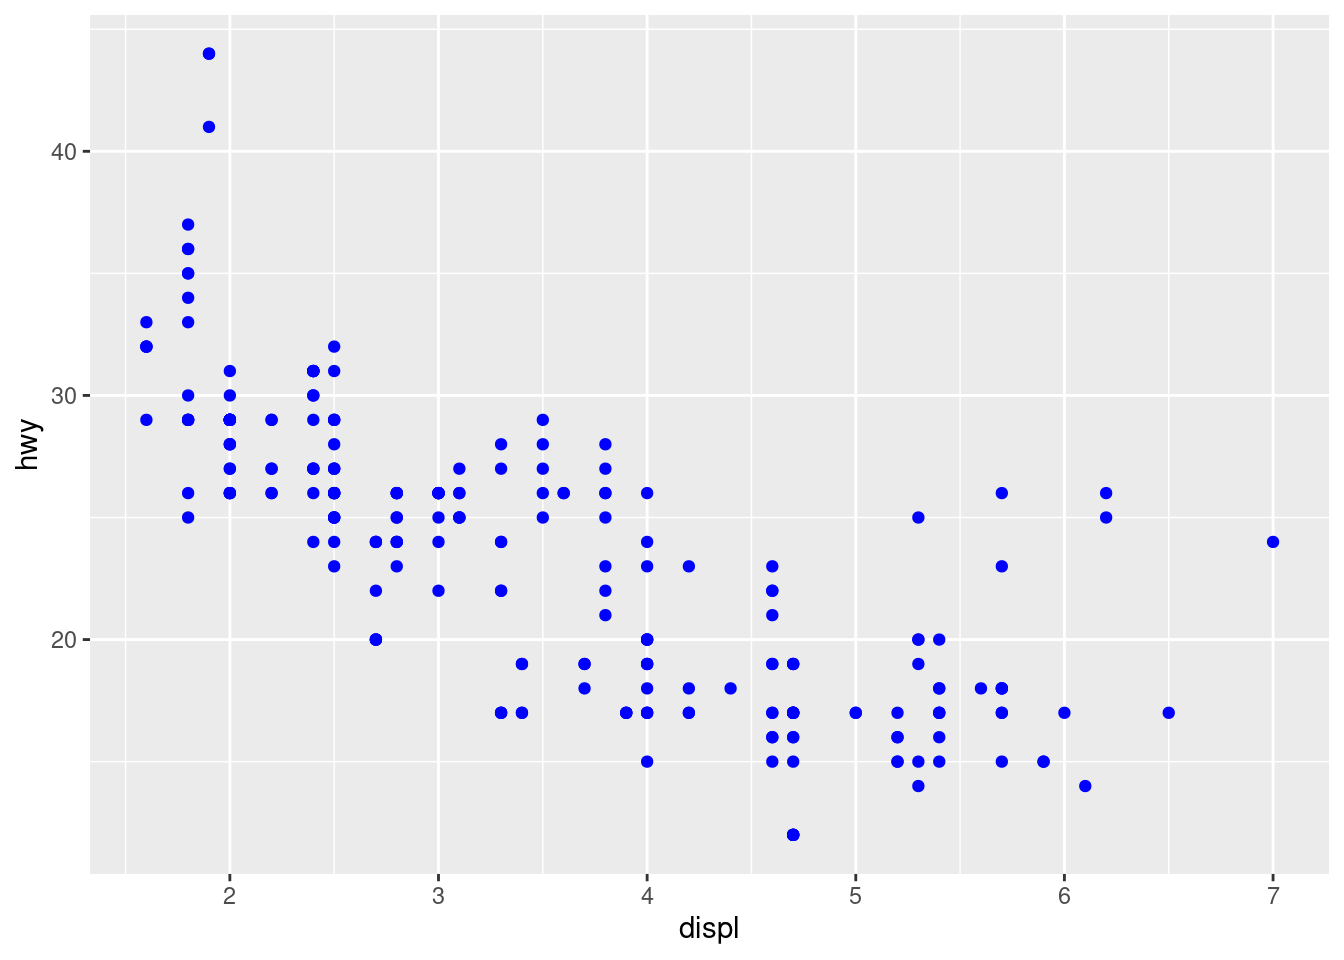
Including a color assignment outside the aesthetic of the geometry layer will make all of the points that color.
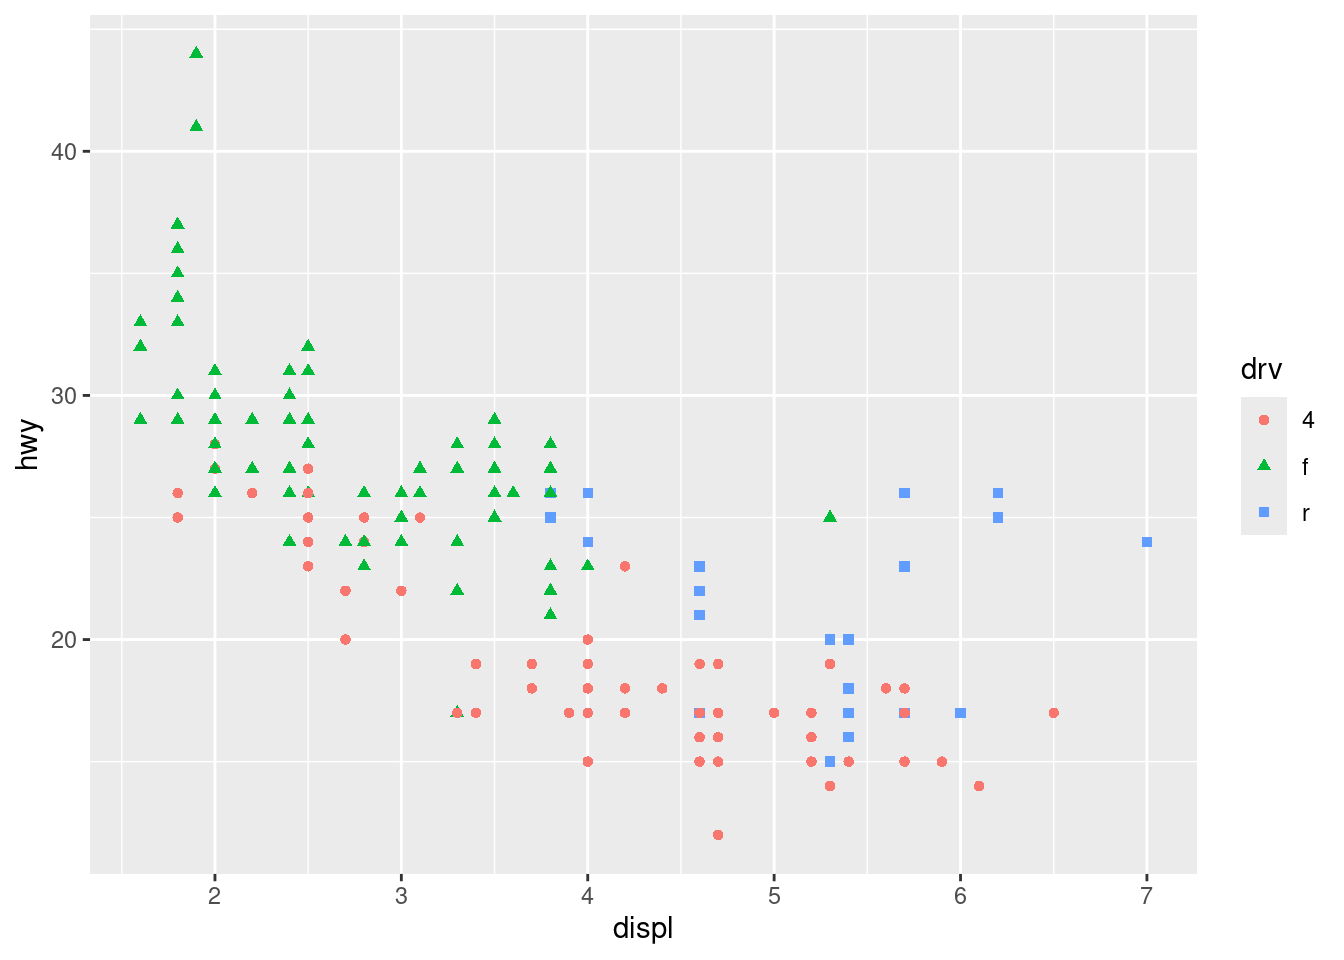
Mapping a variable to shape and color adds some diversity and information to the plot.
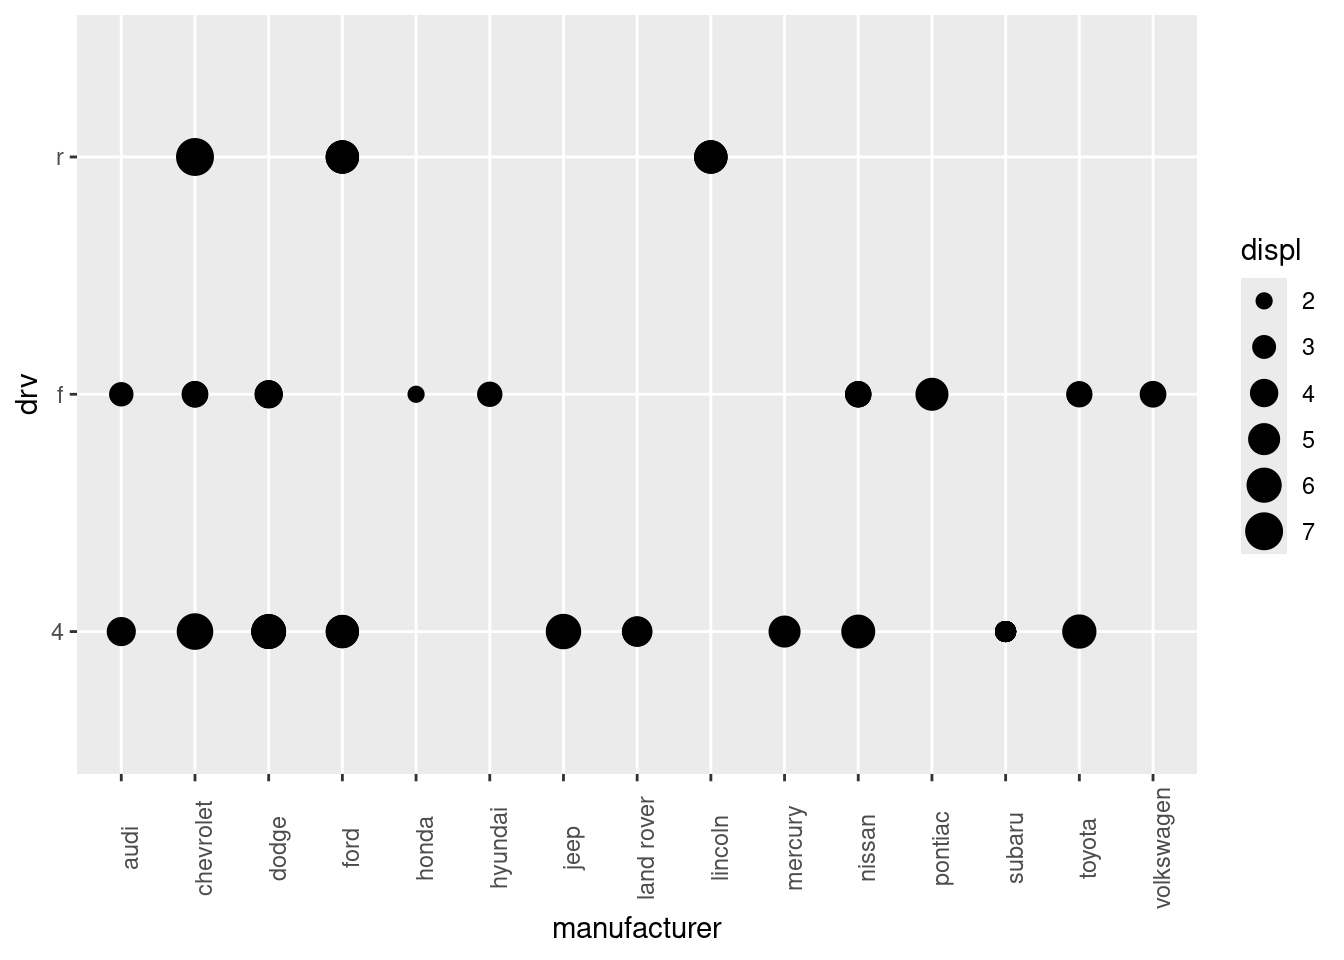
Mapping a variable to size can also add some new insights.
ggplot(mpg, aes(manufacturer, drv, size = displ)) +
  geom_point() +
  theme(axis.text.x = element_text(angle = 90))