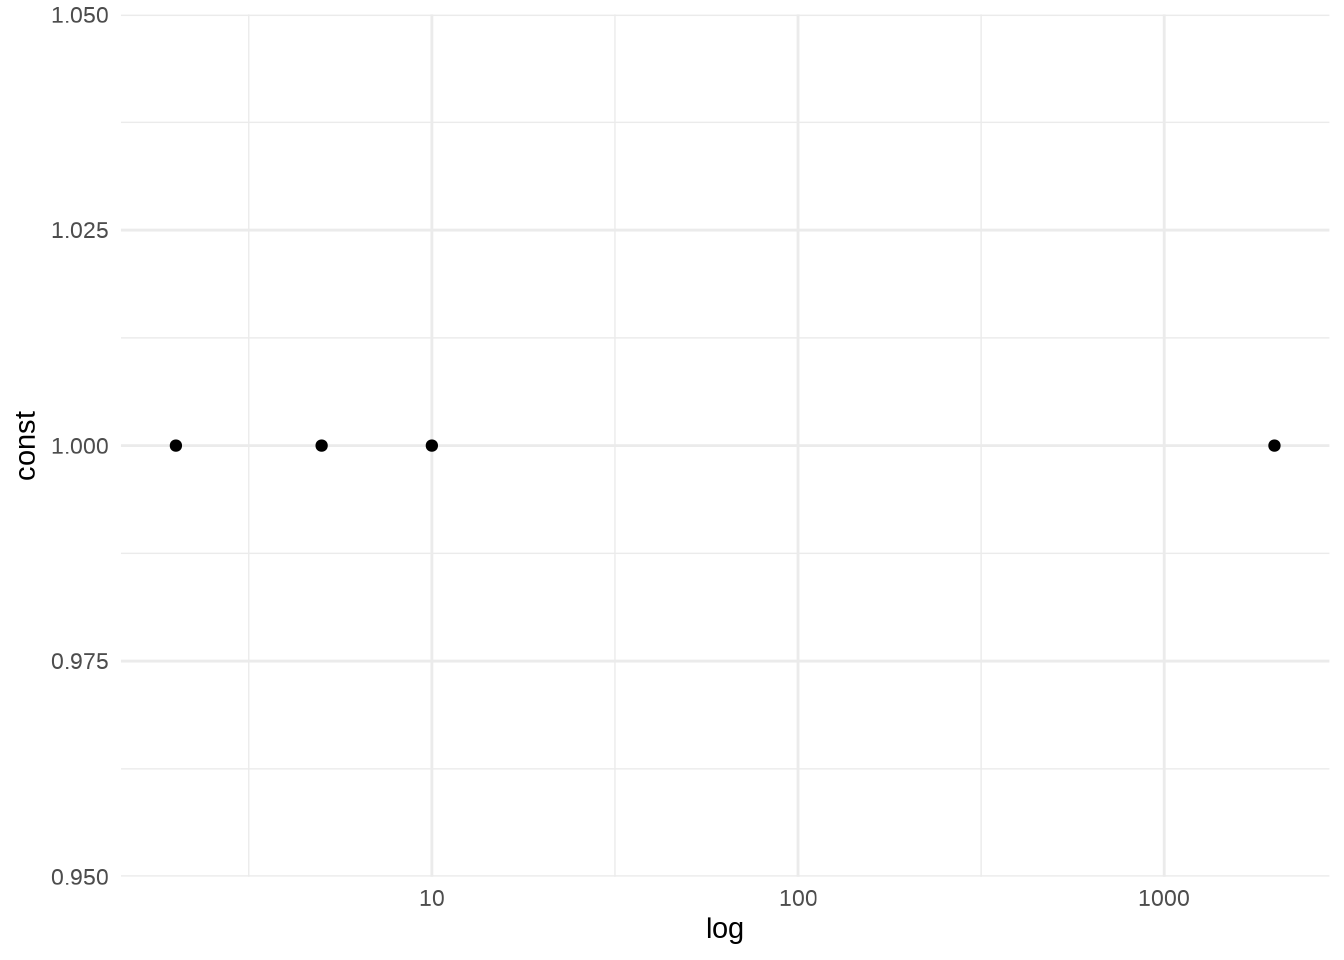
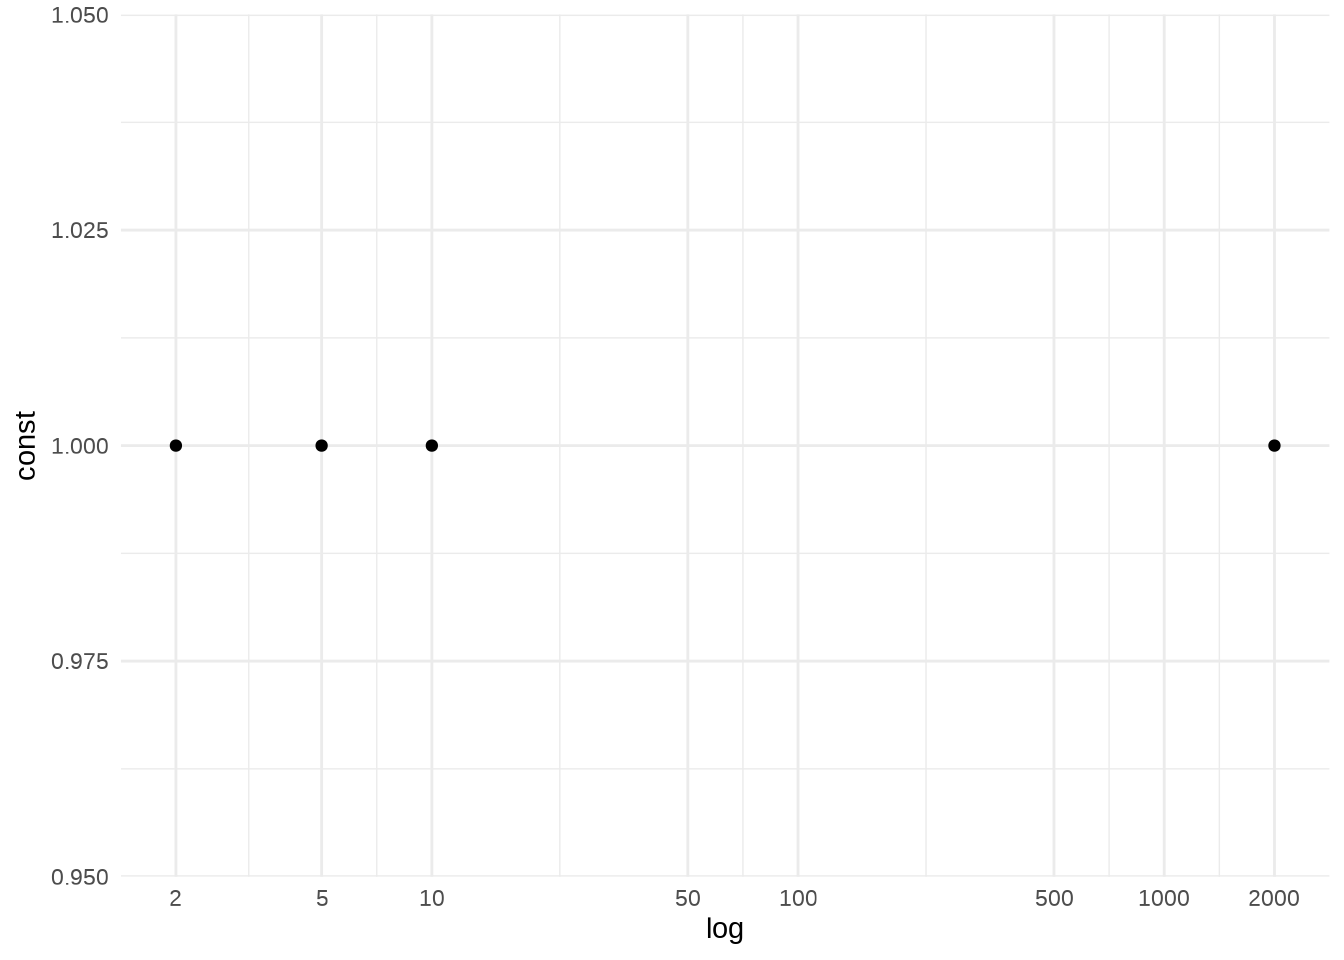
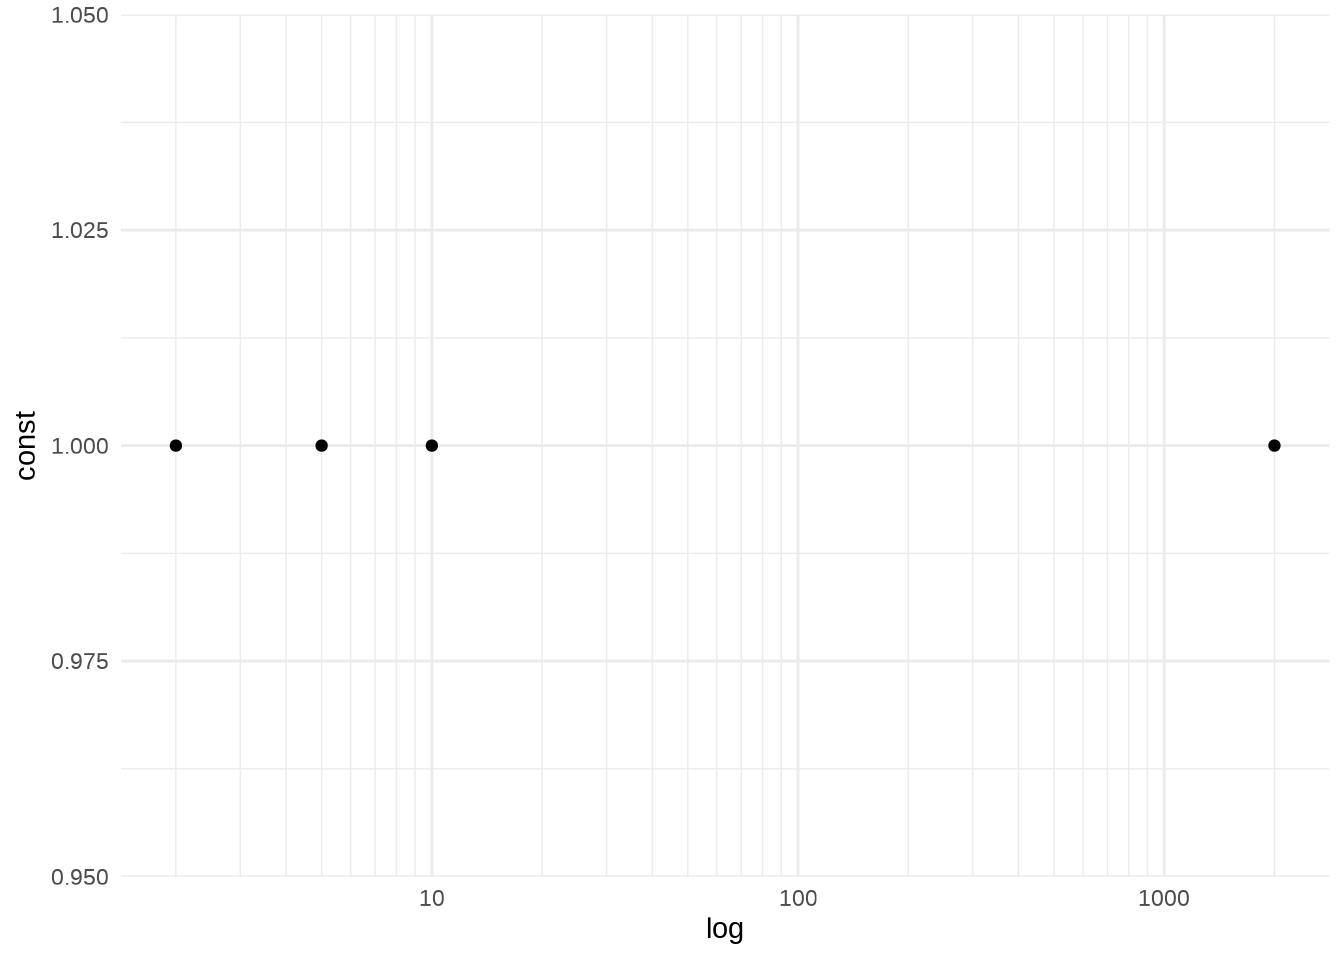
Minor breaks
You can adjust the minor breaks (the unlabeled faint grid lines that appear between the major grid lines).
You can also supply a function to
minor_breaks, such asscales::minor_breaks_n()orscales::minor_breaks_width()First let’s create a vector of minor break values.
##  [1]     1     2     3     4     5     6     7     8     9    10    20    30
## [13]    40    50    60    70    80    90   100   200   300   400   500   600
## [25]   700   800   900  1000  2000  3000  4000  5000  6000  7000  8000  9000
## [37] 10000- Now let’s create a plot:


