Modifying the Axes
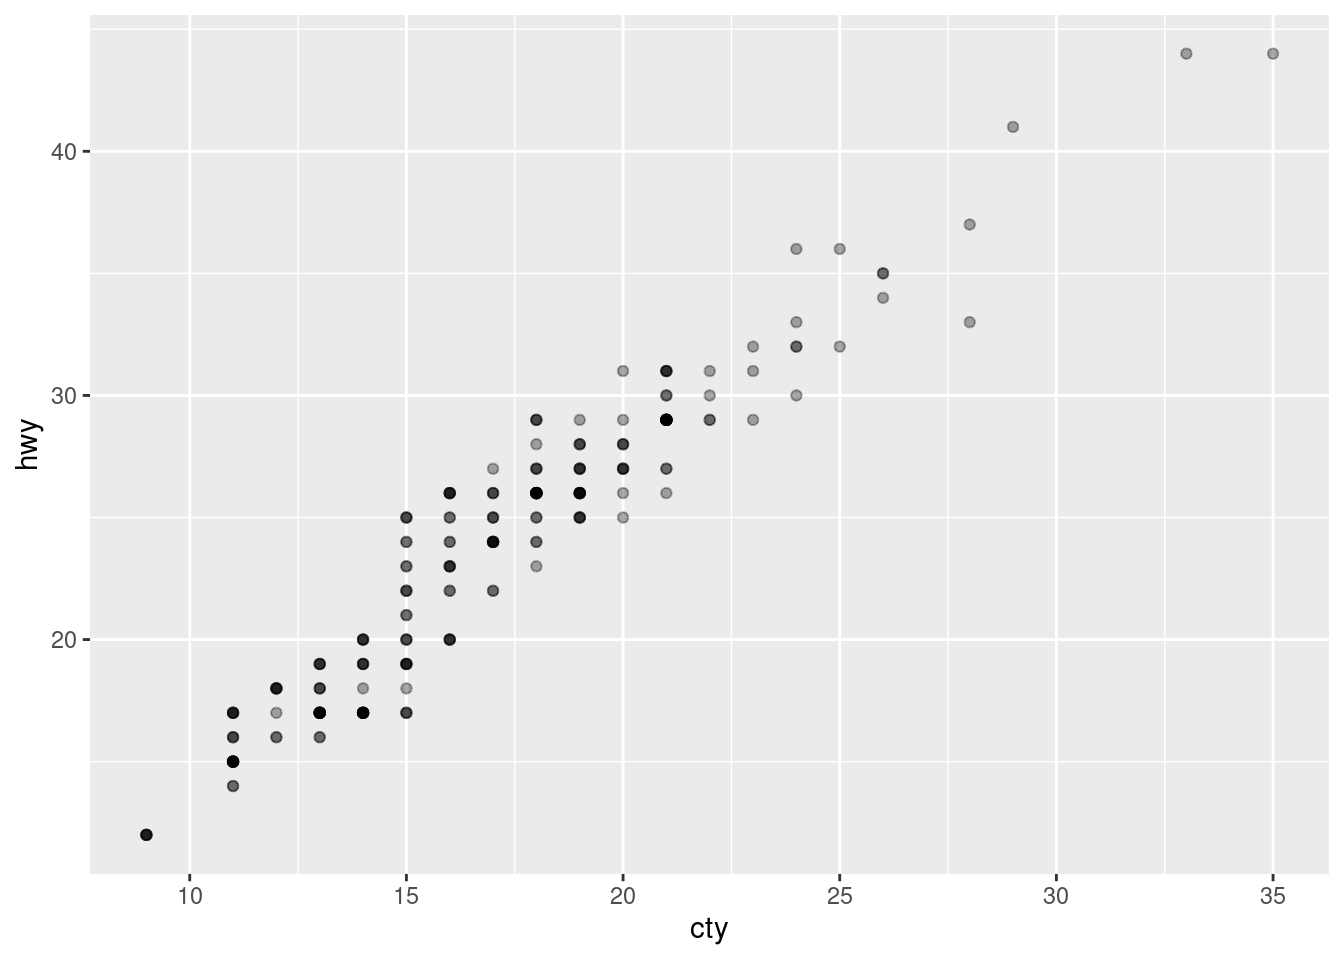
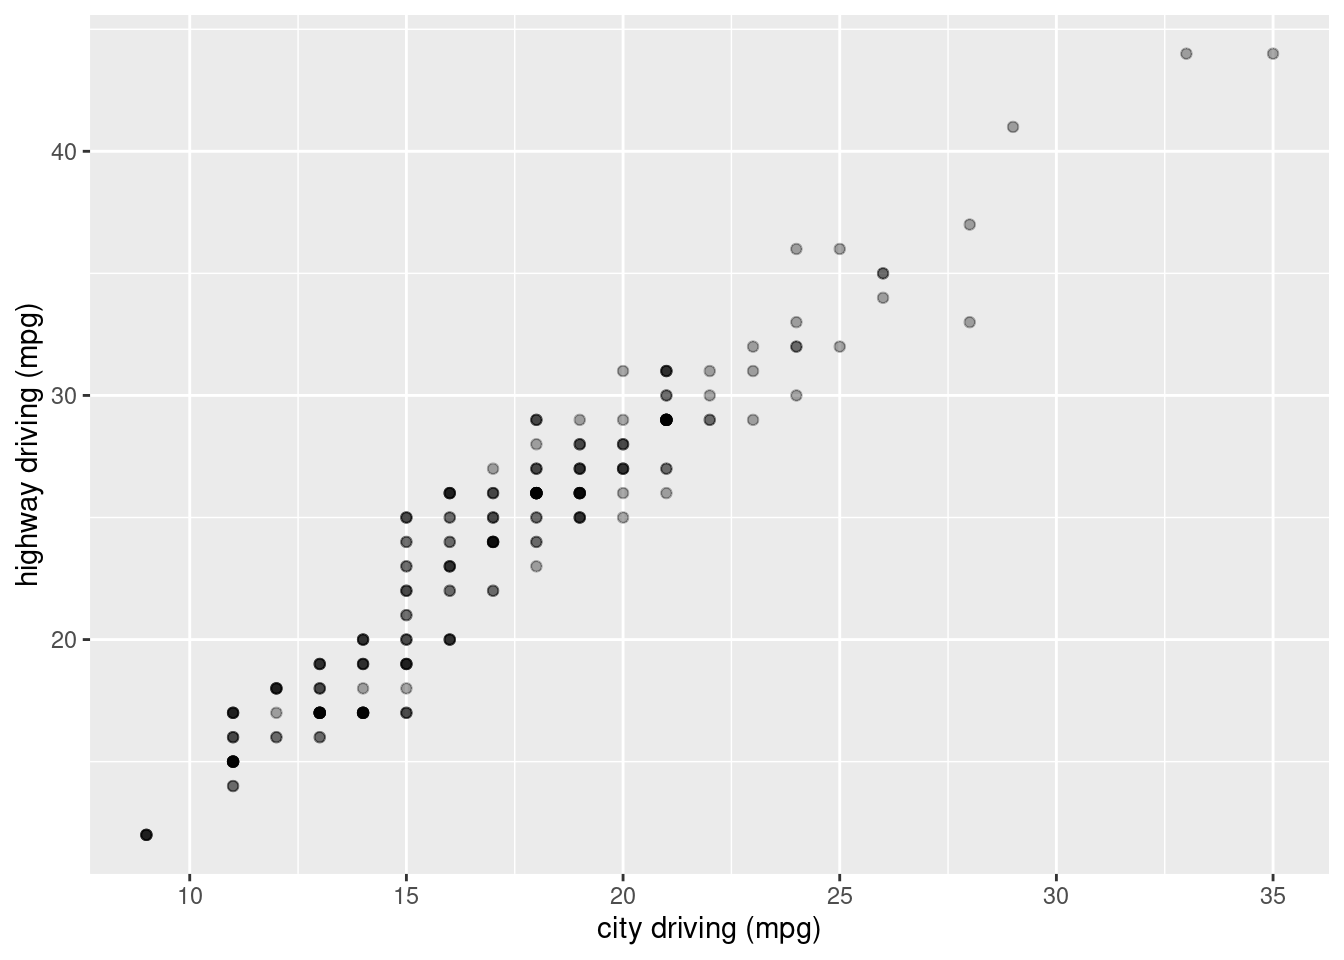
xlab() and ylab() modify the axis labels
ggplot(mpg, aes(cty, hwy)) +
  geom_point(alpha = 1/3)
ggplot(mpg, aes(cty, hwy)) +
  geom_point(alpha = 1/3) +
  xlab("city driving (mpg)") +
  ylab("highway driving (mpg)")
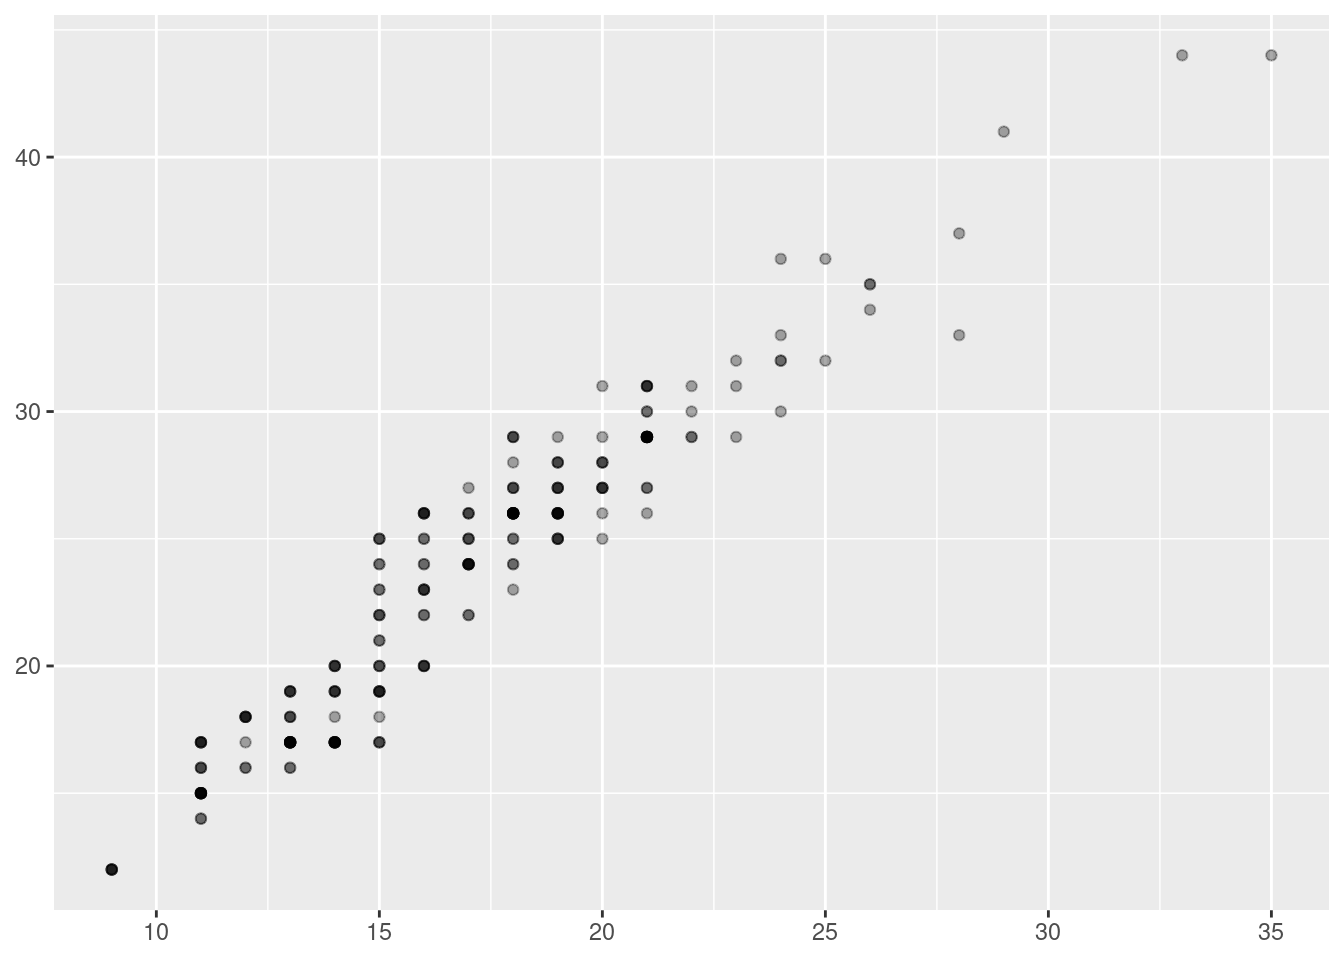
# remove labels with NULL
ggplot(mpg, aes(cty, hwy)) +
  geom_point(alpha = 1/3) +
  xlab(NULL) +
  ylab(NULL)
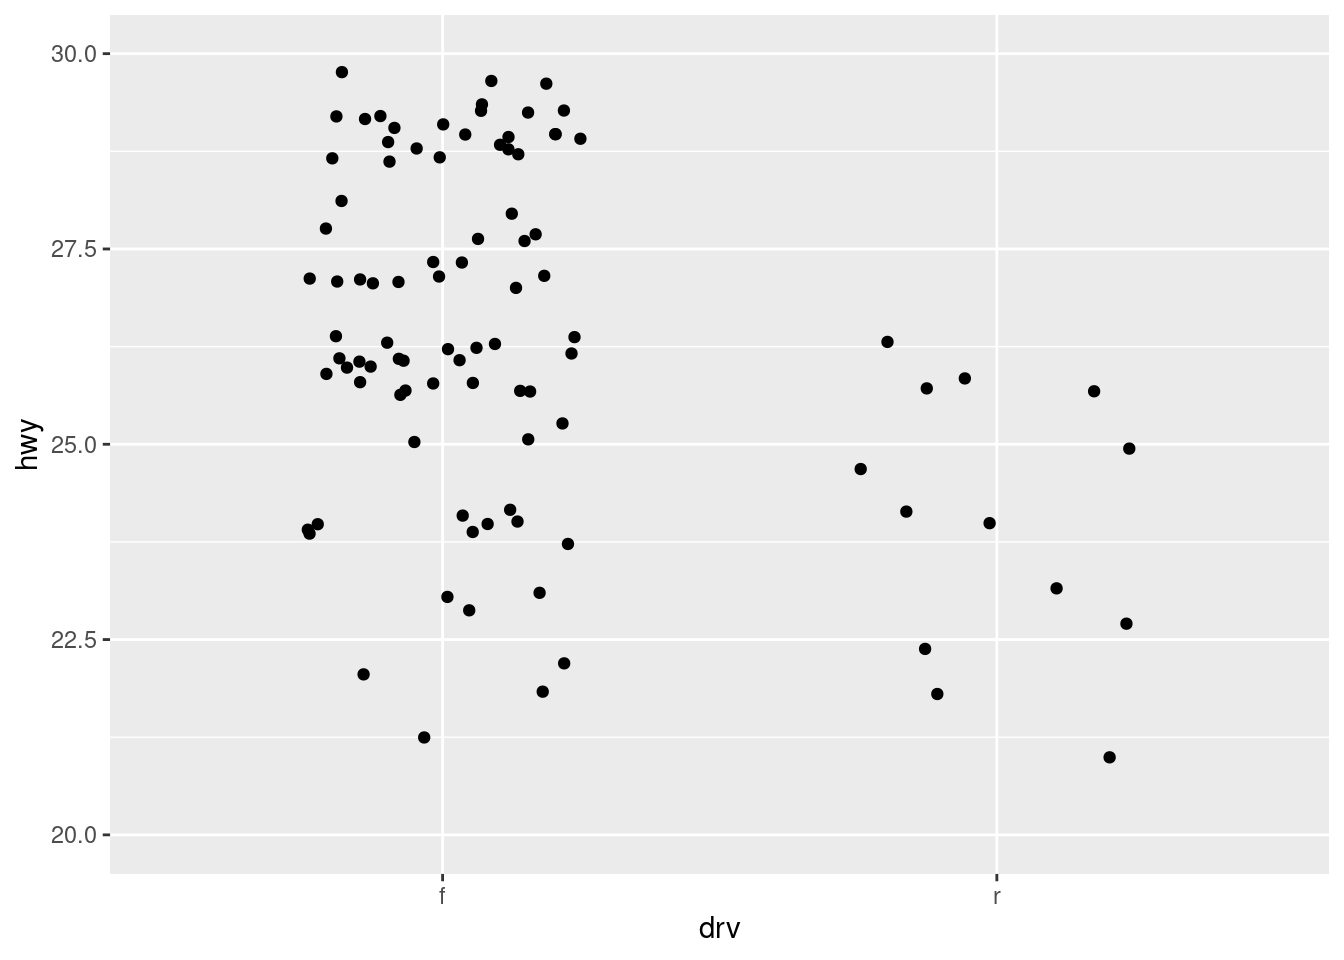
xlim() and ylim() modify the limits of the axes (boundaries)
ggplot(mpg, aes(drv, hwy)) +
  geom_jitter(width = 0.25)
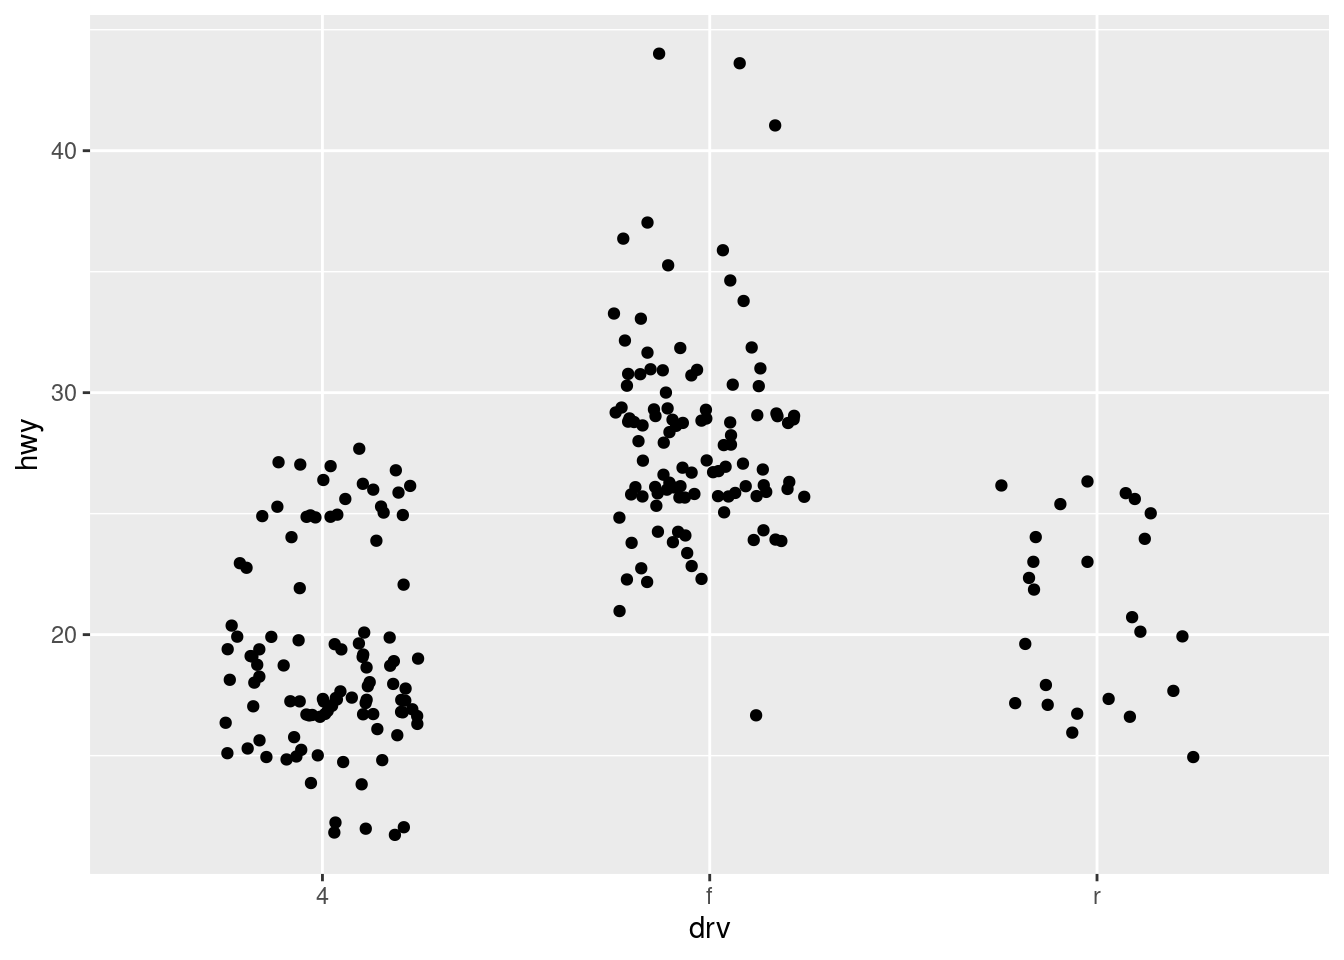
ggplot(mpg, aes(drv, hwy)) +
  geom_jitter(width = 0.25) +
  xlim("f", "r") +
  ylim(20, 30)
## Warning: Removed 139 rows containing missing values or values outside the scale range
## (`geom_point()`).
