ASIDE - geom_sf() + limits
Example from Twitter:
https://twitter.com/Josh_Ebner/status/1470818469801299970?s=20
Reprexes from Ryan S:
## # A tibble: 6 × 2
##   x_coord y_coord
##     <dbl>   <dbl>
## 1       1       1
## 2       1       2
## 3       2       1
## 4       3       2
## 5       6       5
## 6       1       1
Full range polygon
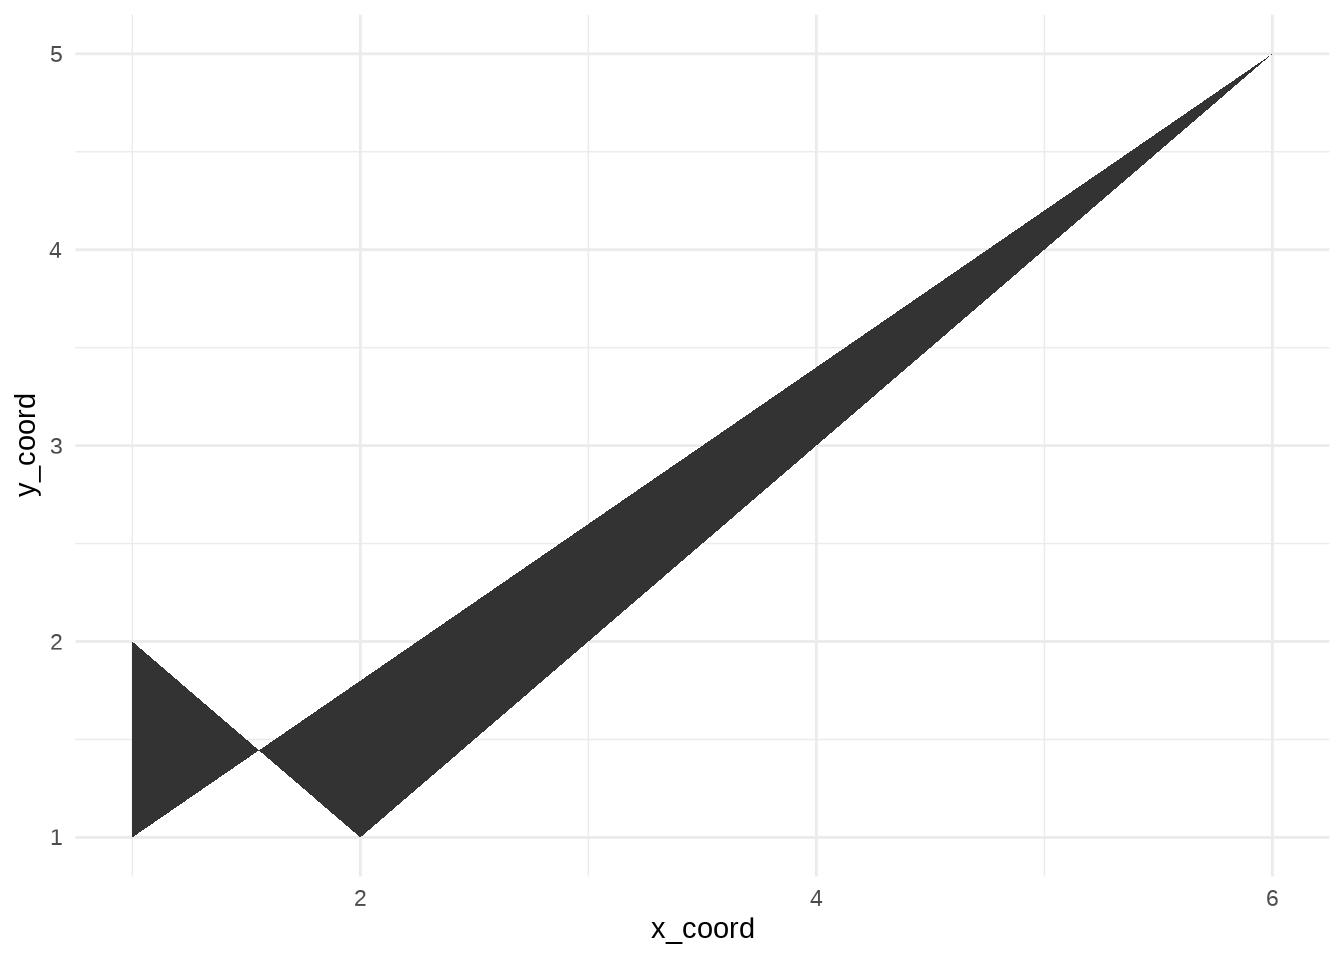
Polygon with limits
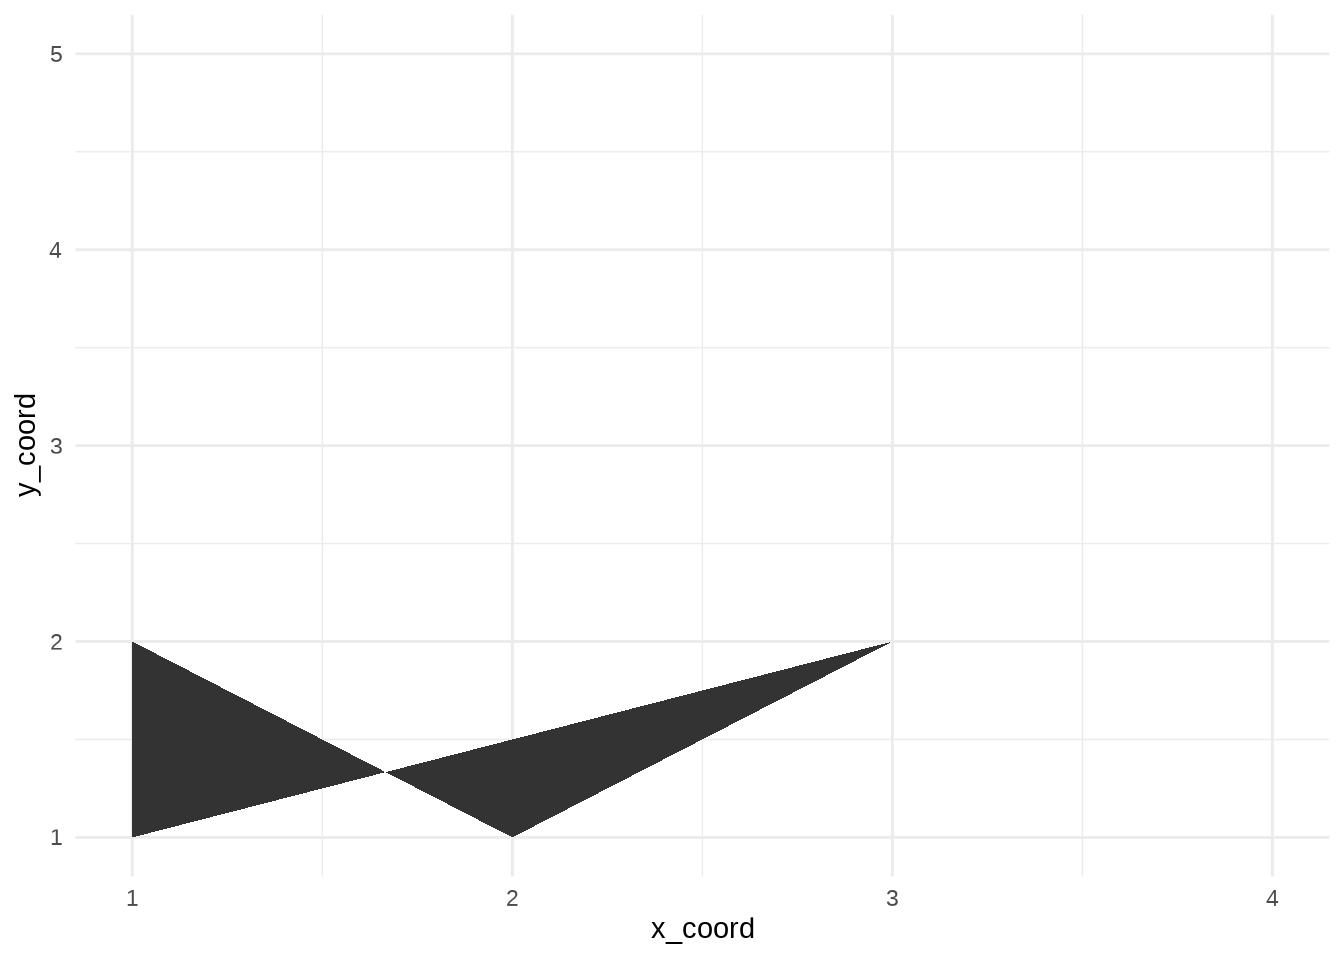
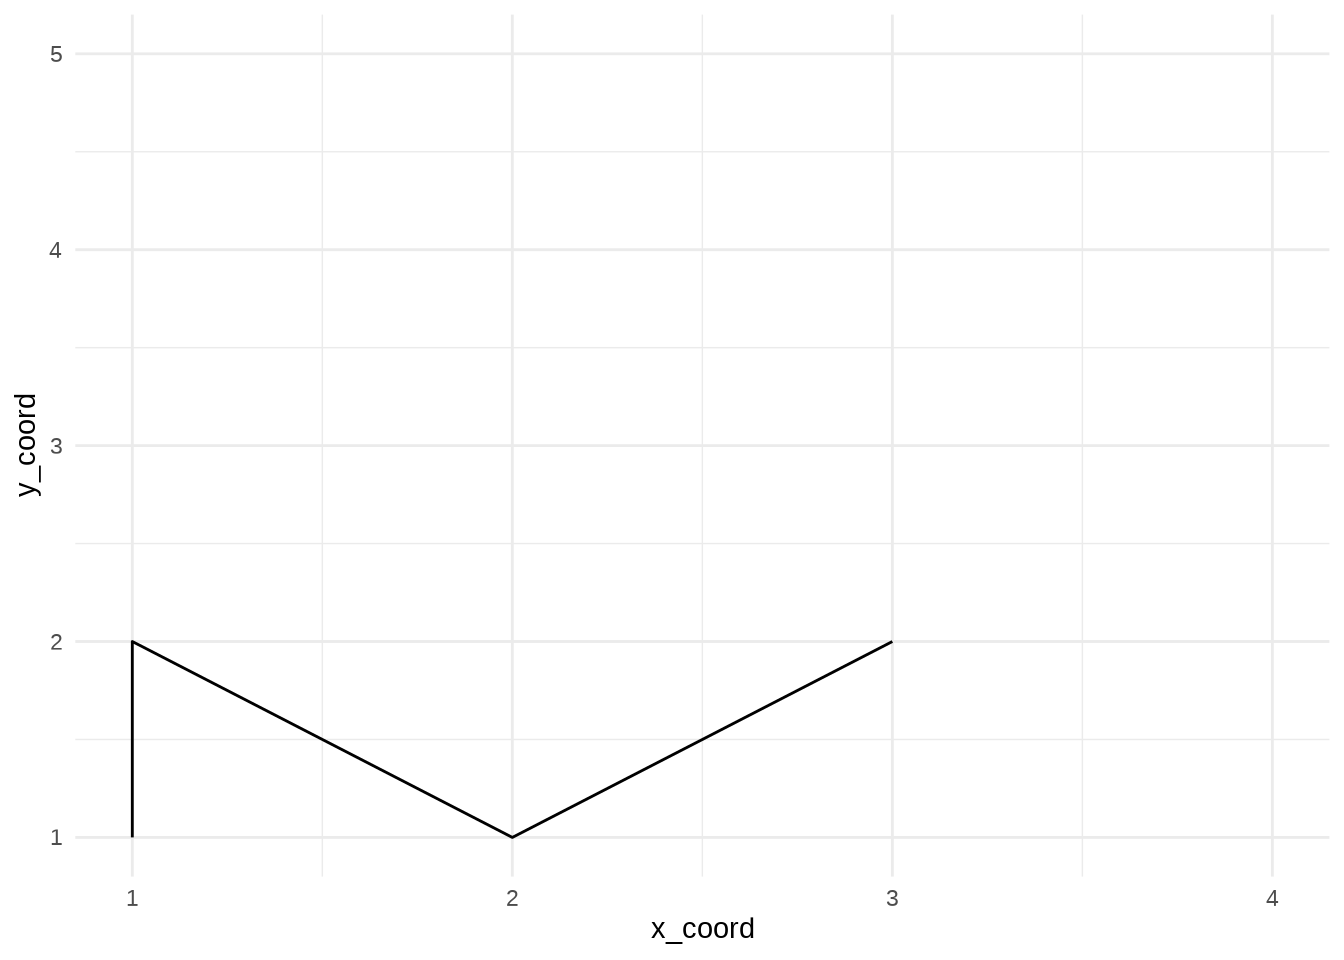
Path with limits
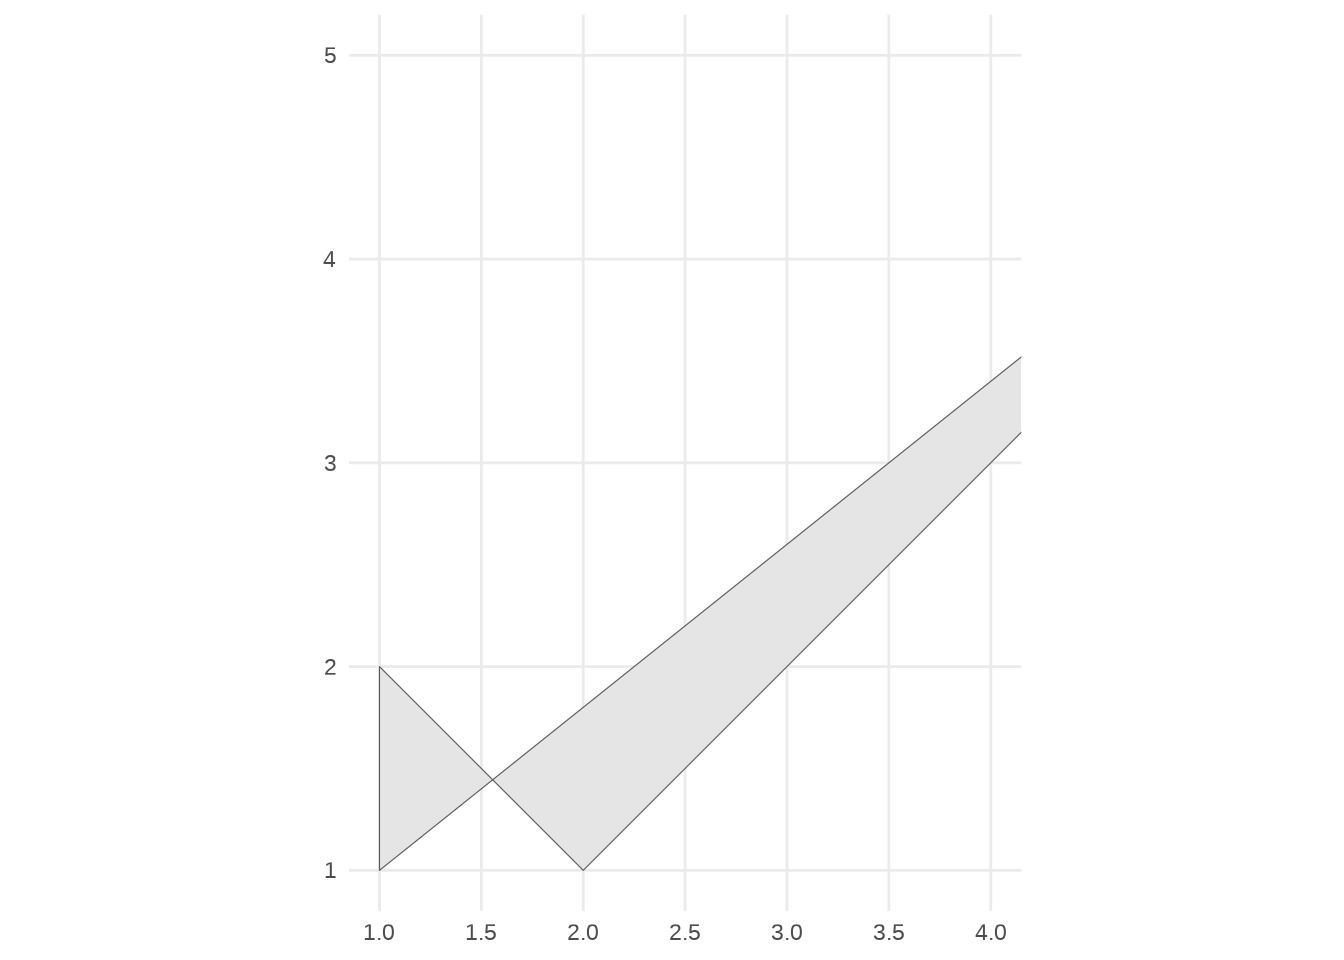
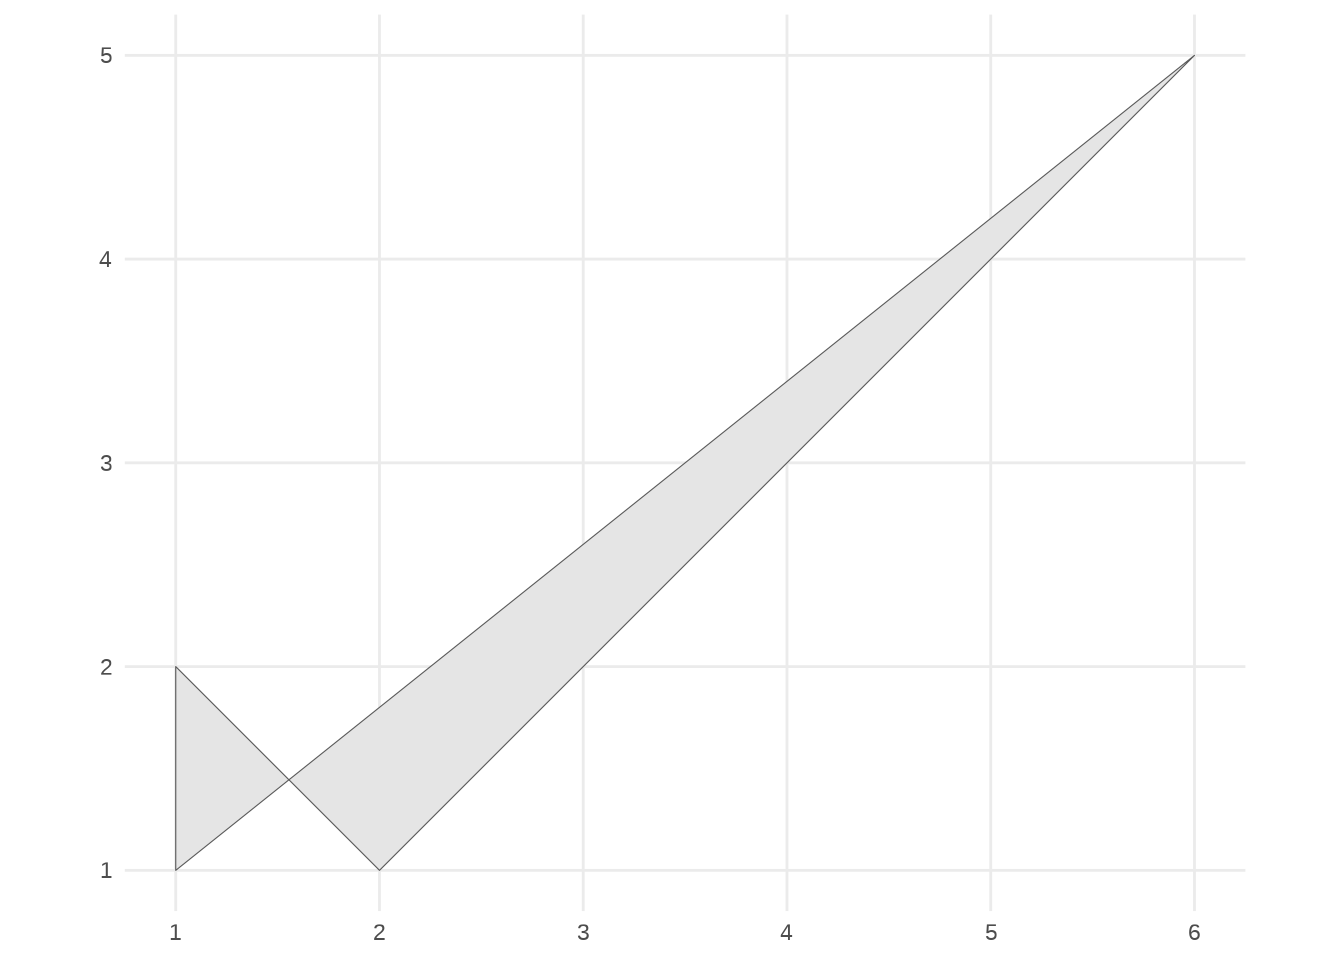
geom_sf() without limits
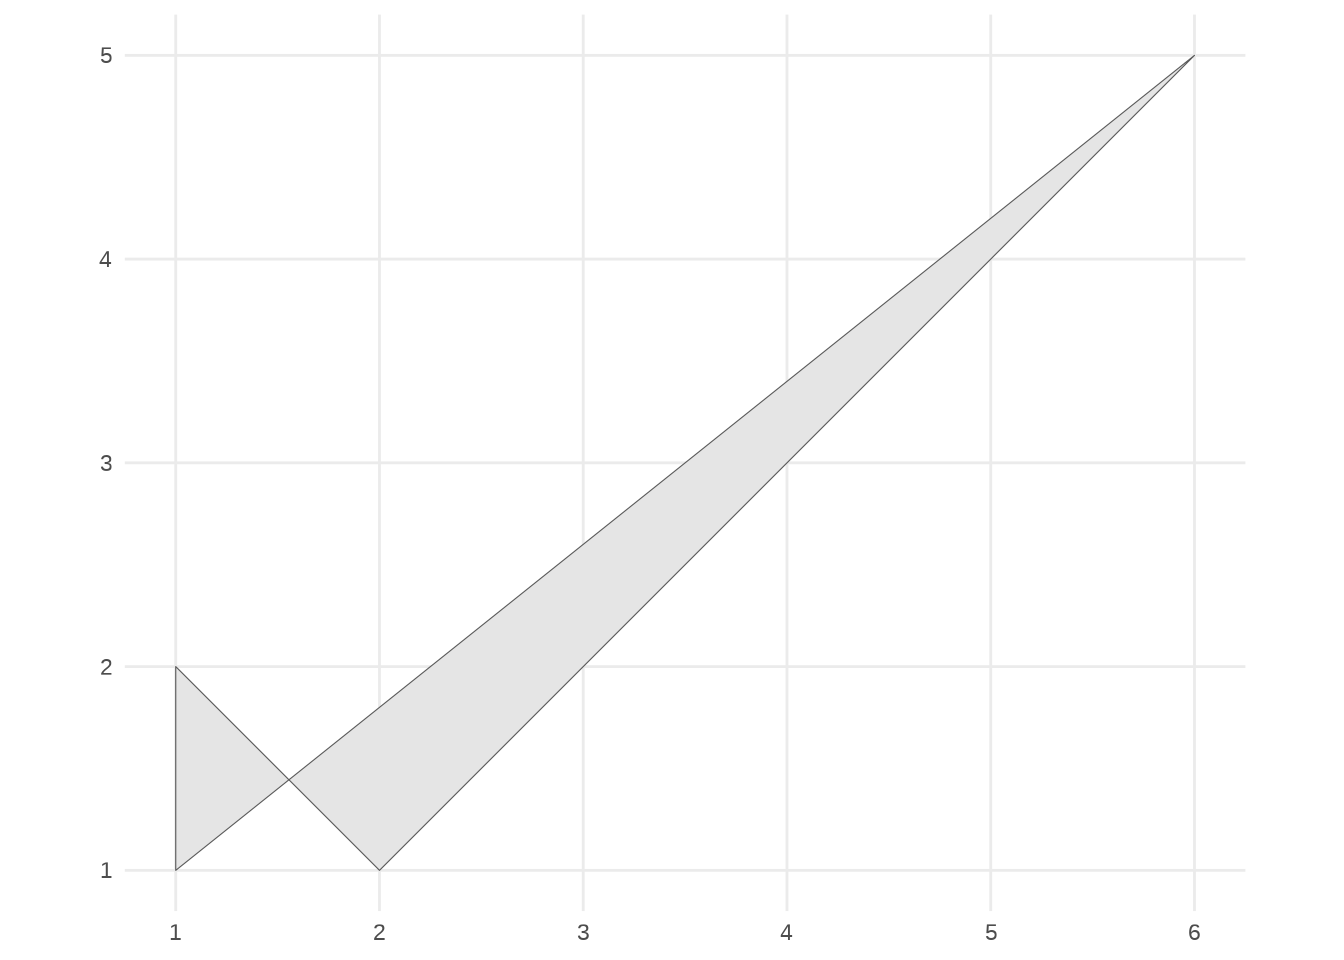
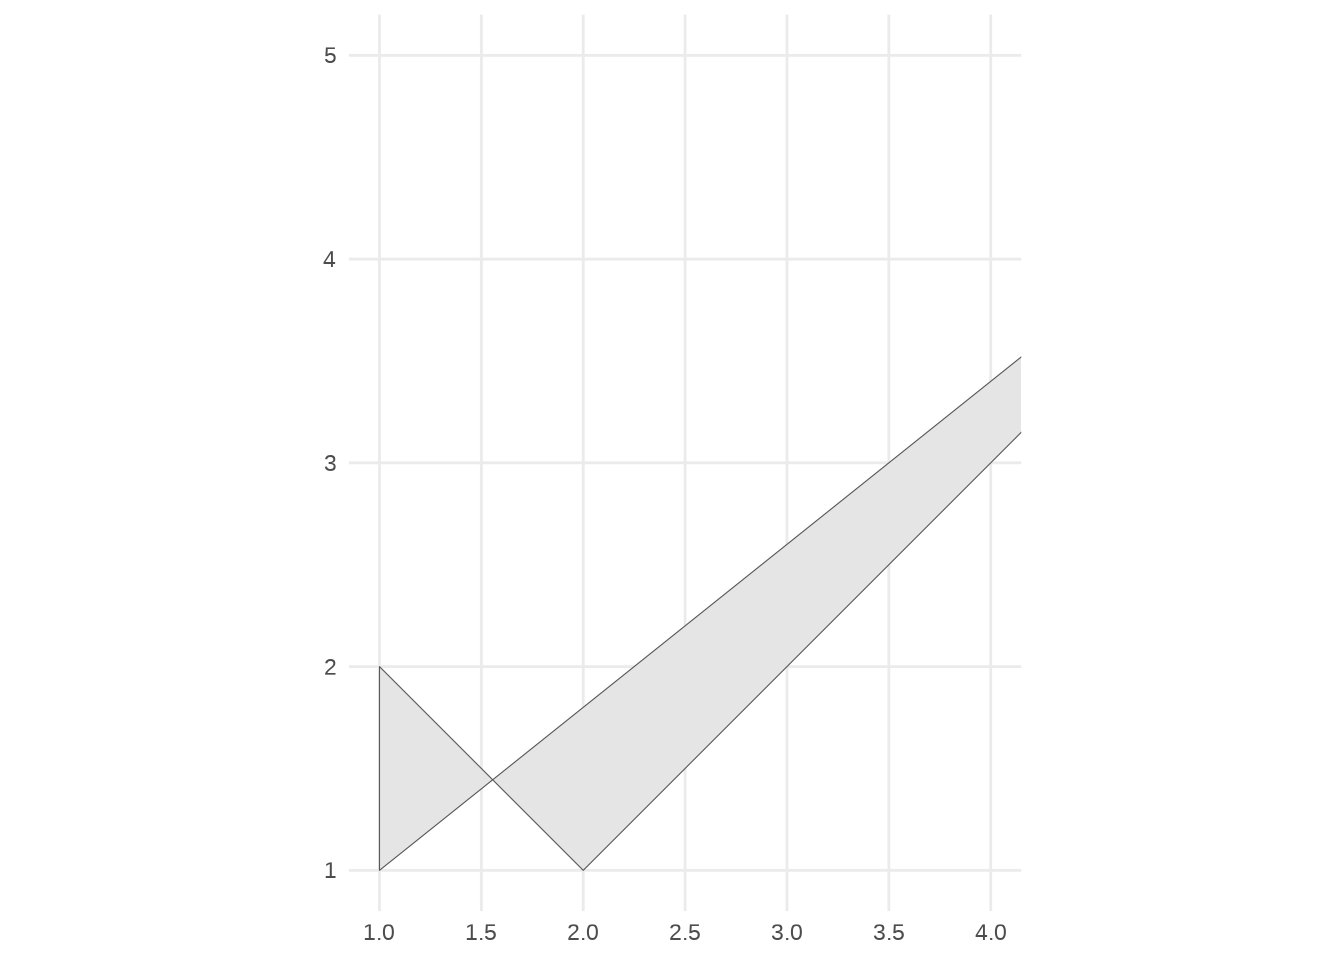
geom_sf() with limits
Further exploration
Using geom_sf() adds CoordSF by default
## [1] "CoordSf"        "CoordCartesian" "Coord"          "ggproto"
## [5] "gg"
## [1] "CoordSf" "CoordCartesian" "Coord" "ggproto"
## [5] "gg"In fact, geom_sf() must be used with coord_sf()
## Error in `geom_sf()`:
## ! Problem while converting geom to grob.
## ℹ Error occurred in the 1st layer.
## Caused by error in `draw_panel()`:
## ! `geom_sf()` can only be used with `coord_sf()`.
The underlying geometry is untouched (indicating that limits are not removing data)
##                         geometry PANEL group xmin xmax ymin ymax linetype alpha
## 1 POLYGON ((1 1, 1 2, 2 1, 3 ...     1    -1    1    6    1    5        1    NA
##   stroke
## 1    0.5
## geometry PANEL group xmin xmax ymin ymax linetype alpha
## 1 POLYGON ((1 1, 1 2, 2 1, 3 ... 1 -1 1 NA 1 5 1 NA
## stroke
## 1 0.5## [1] TRUEOOB handling inside scale_x|y_continuous() cannot override the behavior
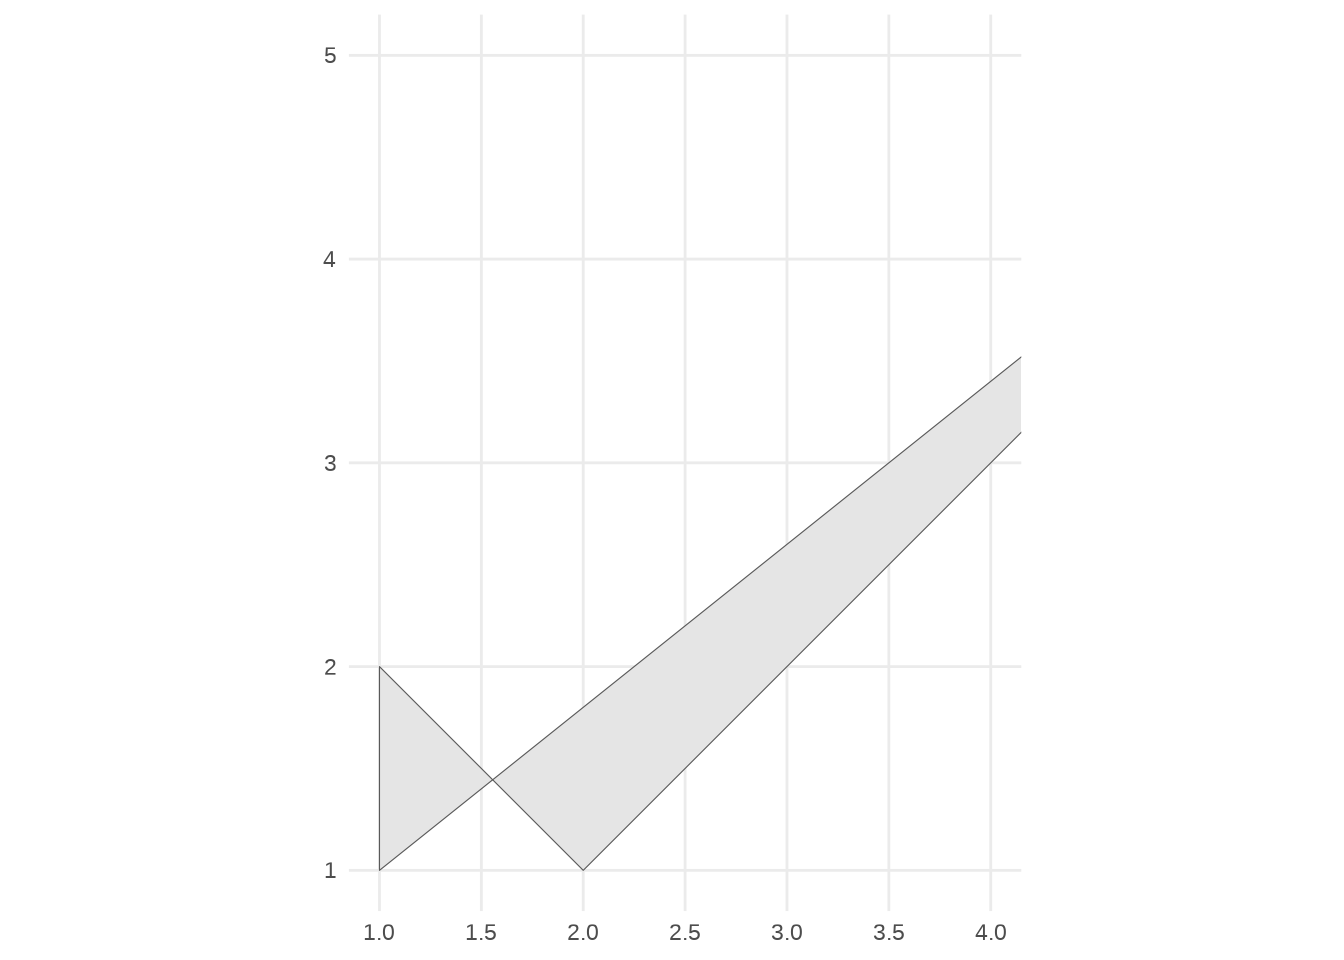
Instead, coord_sf(lims_method = ) offers other spatial-specific methods. Censor doesn’t seem to be one but an option like "geometry_bbox" automatically sets limits to the smallest bounding box that contain all geometries.
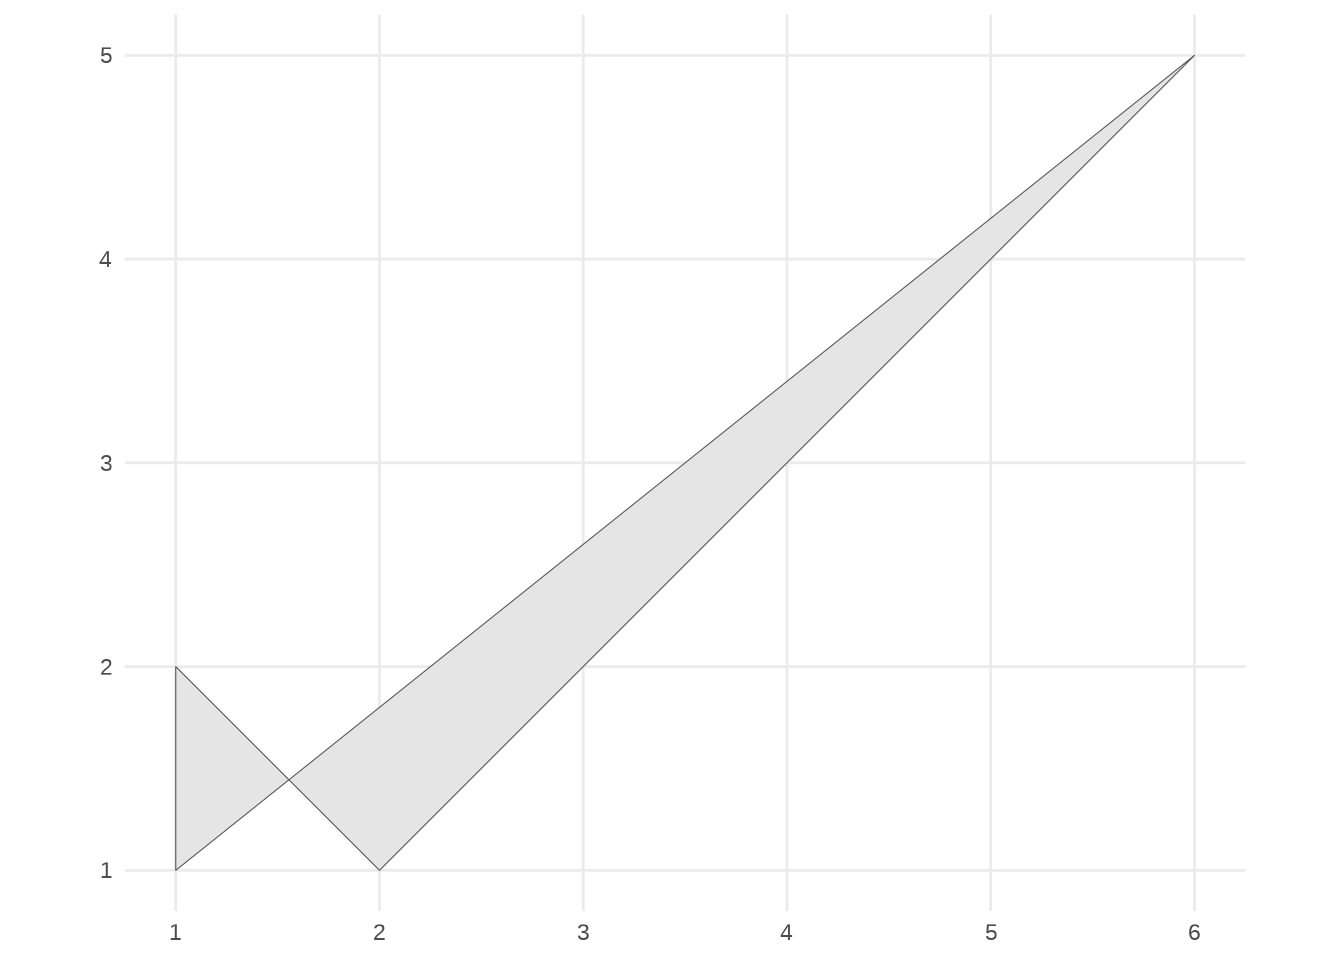
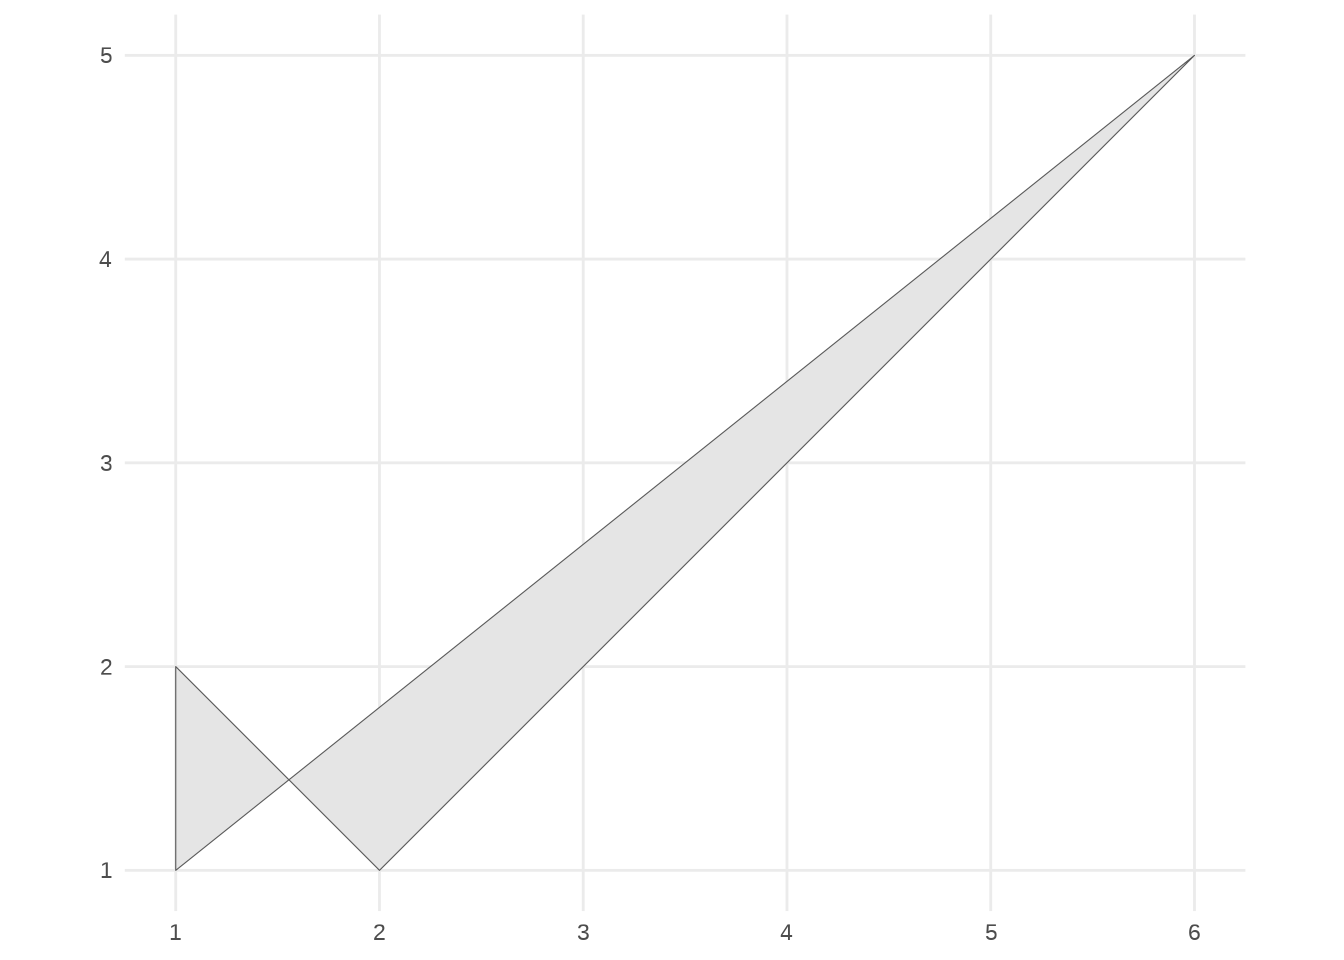
Interesting note from the docs:
… specifying limits via position scales or xlim()/ylim() is strongly discouraged, as it can result in data points being dropped from the plot even though they would be visible in the final plot region.
Internals
Scale censor for geom_polygon()
Scale censor for geom_sf()
Inspecting the rendered geom with layer_grob()

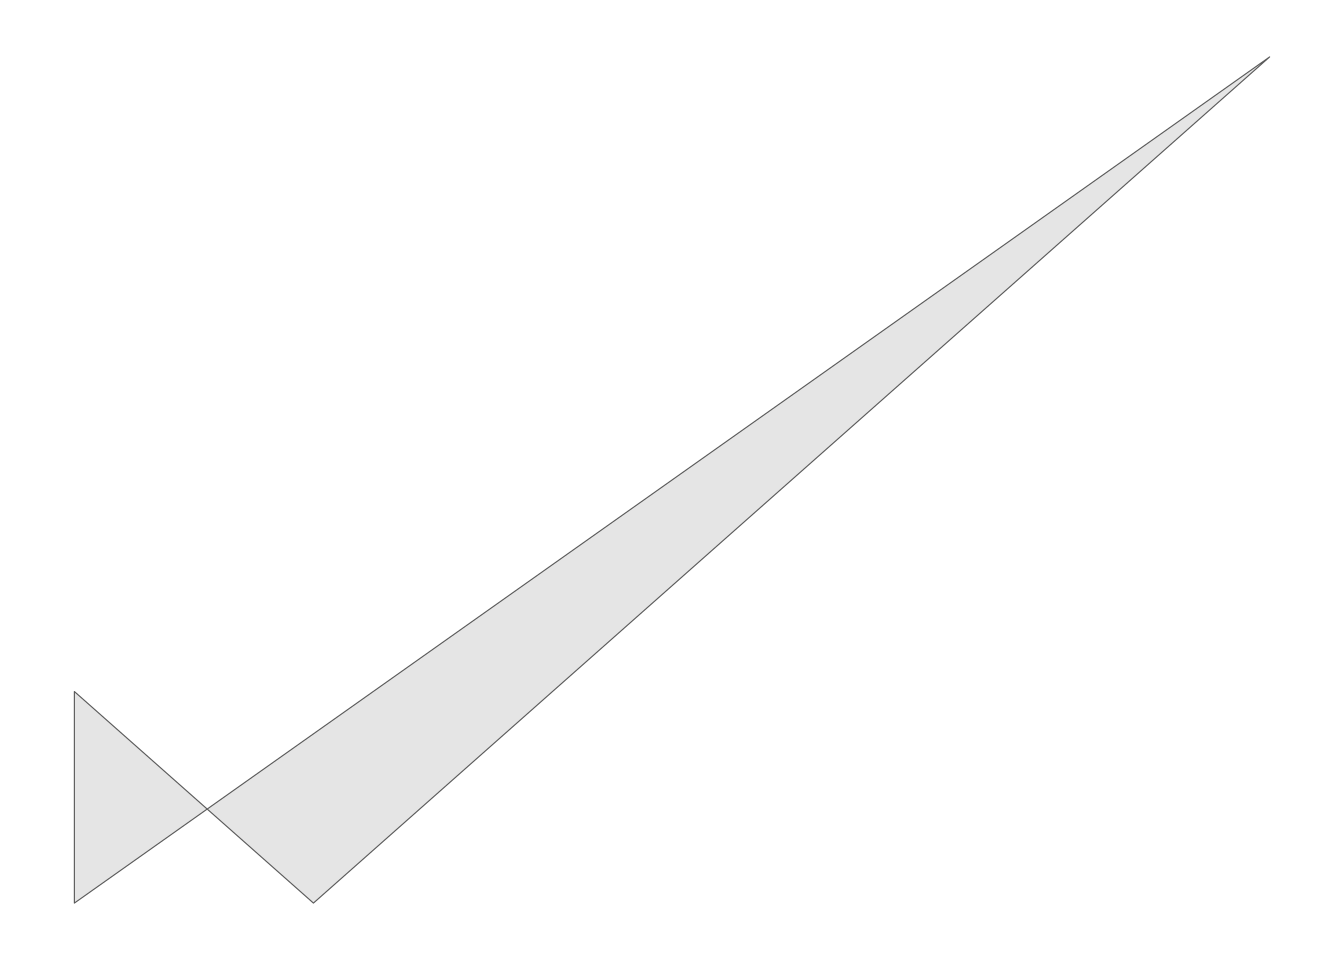
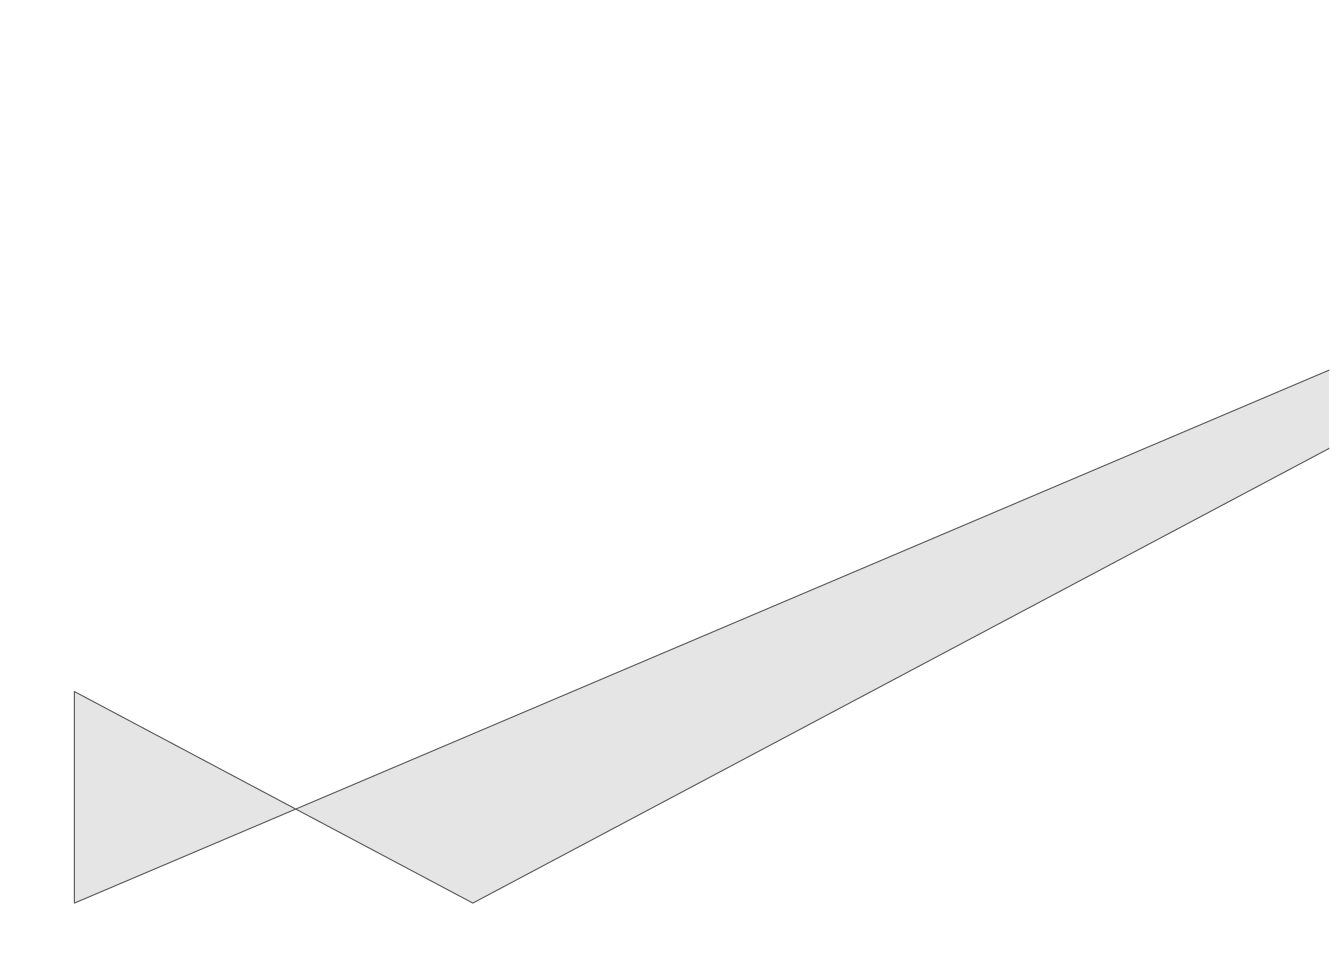
## # A tibble: 6 × 2
##   x                y
##   <simplUnt>       <simplUnt>
## 1 0.04545455native 0.04545455native
## 2 0.04545455native 0.2727273native
## 3 0.2272727native  0.04545455native
## 4 0.4090909native  0.2727273native
## 5 0.9545455native  0.9545455native
## 6 0.04545455native 0.04545455native
## # A tibble: 6 × 2
## x y
## <simplUnt> <simplUnt>
## 1 0.04545455native 0.04545455native
## 2 0.04545455native 0.2727273native
## 3 0.3484848native 0.04545455native
## 4 0.6515152native 0.2727273native
## 5 1.560606native 0.9545455native
## 6 0.04545455native 0.04545455native