Introduction
- Position scales control the locations of visual entities in a plot and how those locations are mapped to data values.
- usually x- and y-axis
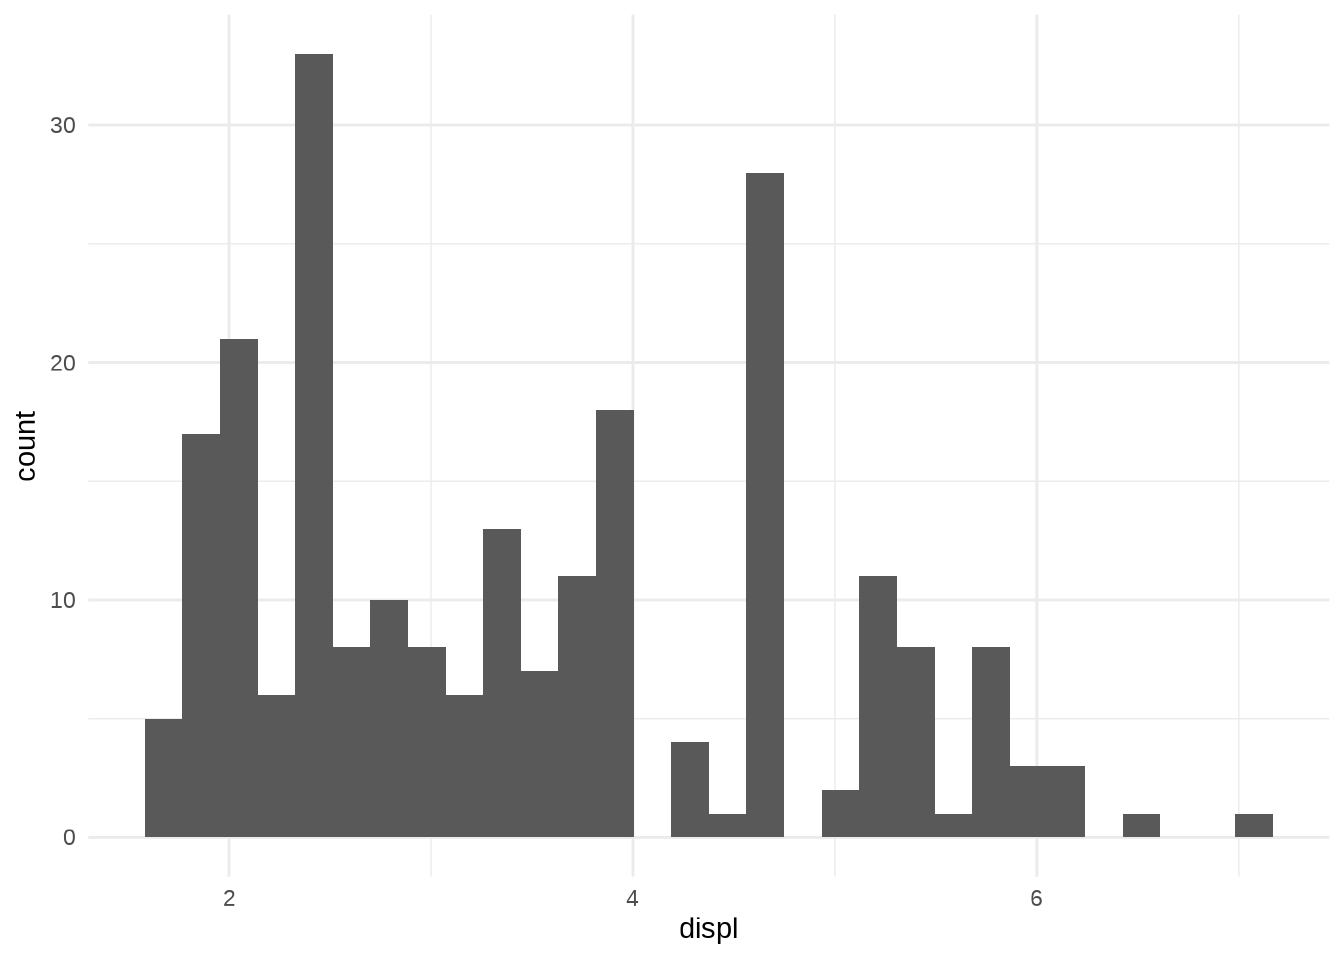
- However, some plots require that you specify only one axis:
geom_histogram()which computes acountvariables that gets mapped into the y aesthetic.