2.7 Faceting
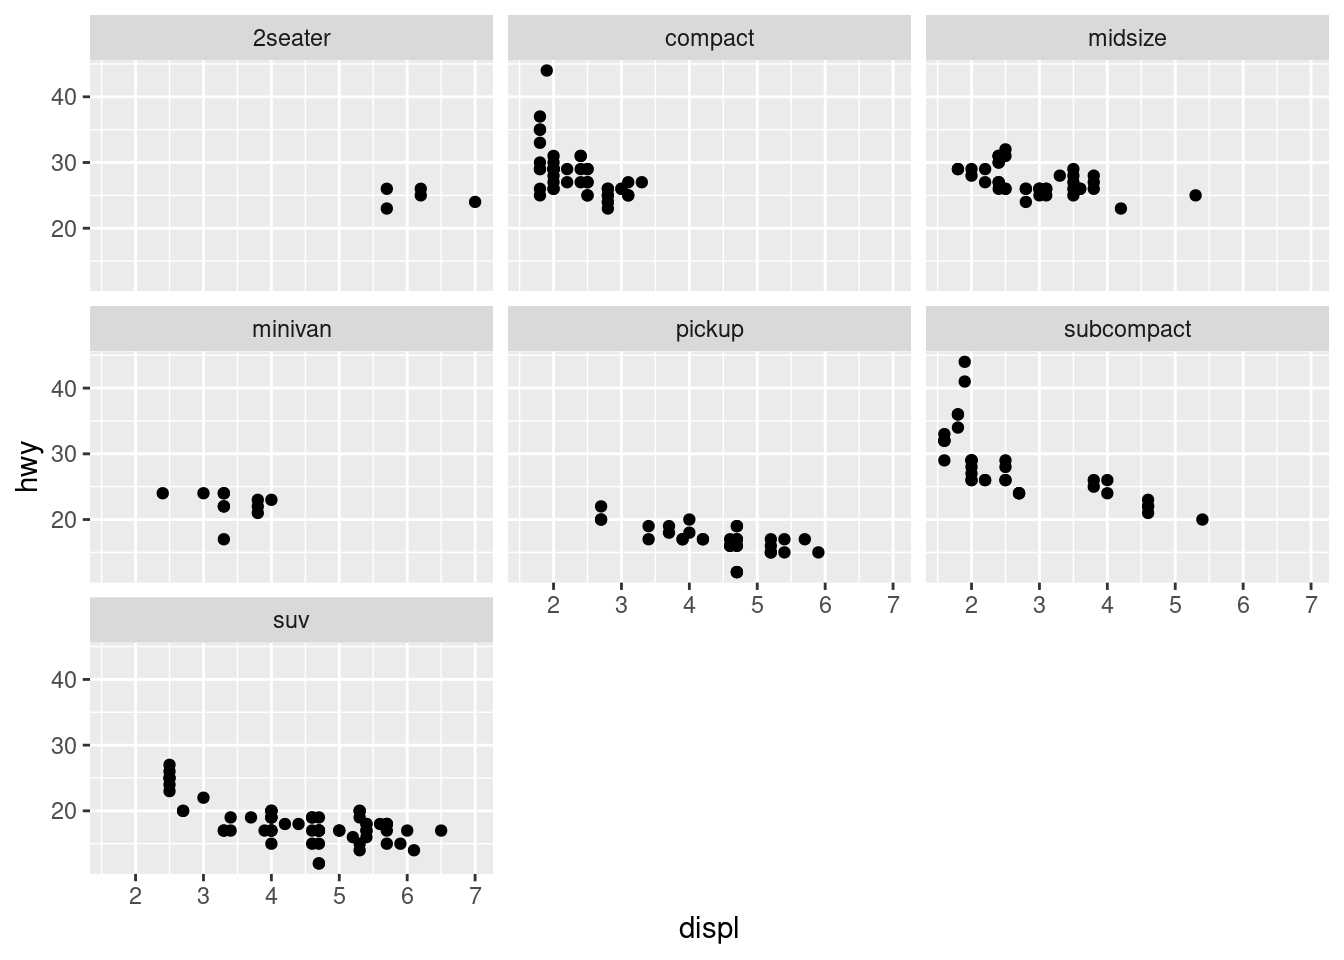
Faceting creates graphics by splitting the data into subsets and displaying the same graph for each subset. Really helpful if there are lots of values, making color/shape less meaningful.

- Exercise: Use faceting to explore the three-way relationship between fuel economy, engine size and number of cylinders. How does faceting by number of cylinders change your assessment of the relationship between engine size and fuel economy?