2.8 Geoms
The geom_point() geom gives a familiar scatterplot.
Other geoms include:
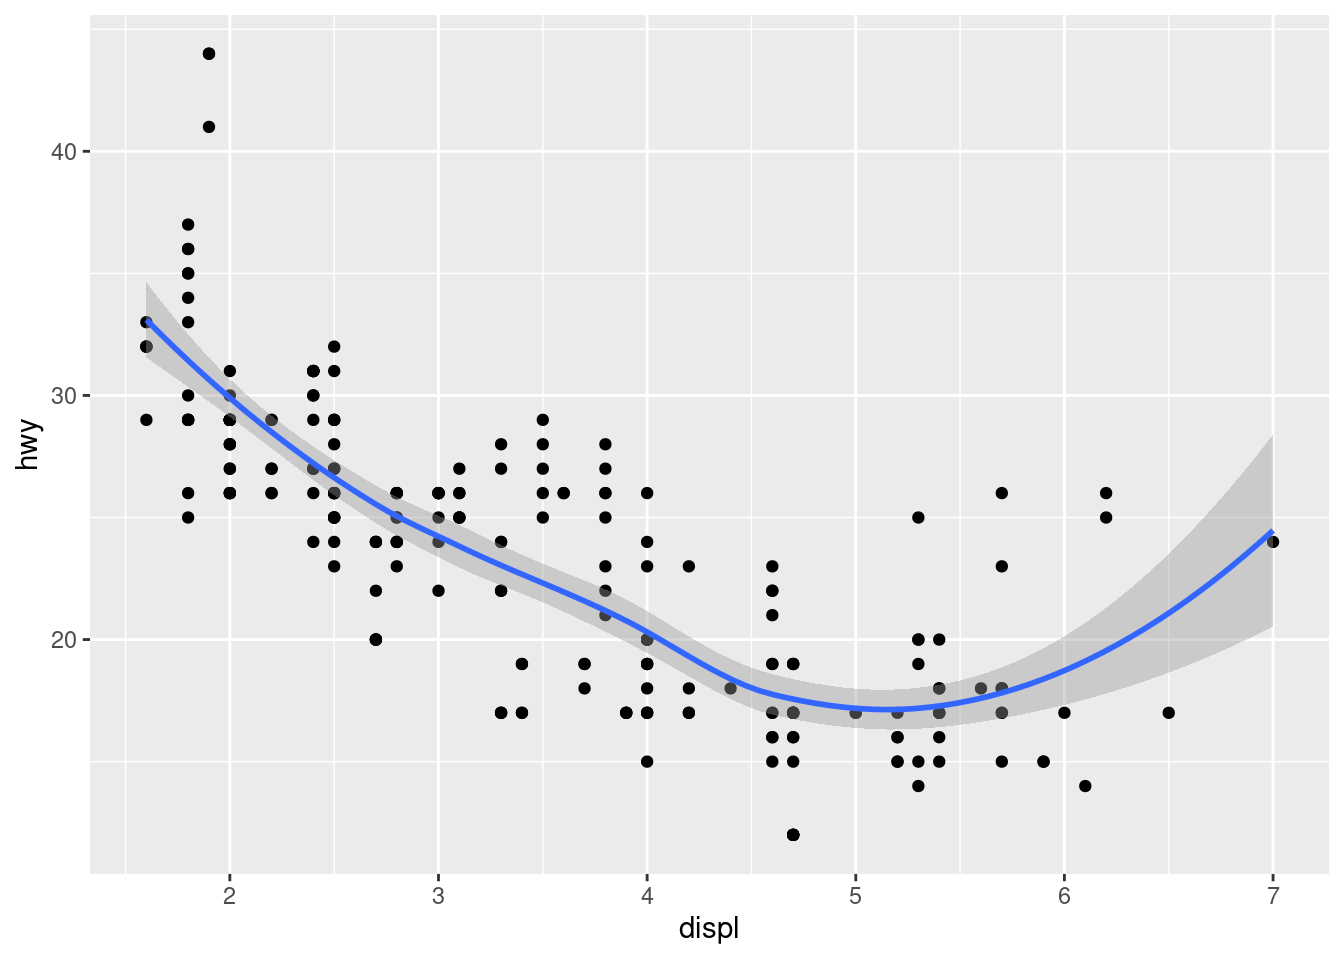
geom_smooth()which fits a smooth line to the data- check
helpto seegeom_smooth’s arguments likemethod,seorspan.
- check
geom_boxplot()which generates a box-and-whisker plot- check
helpto seegeom_boxplot’s arguments likeoutlierarguments, andcoefwhich adjusts the whisker length.
- check
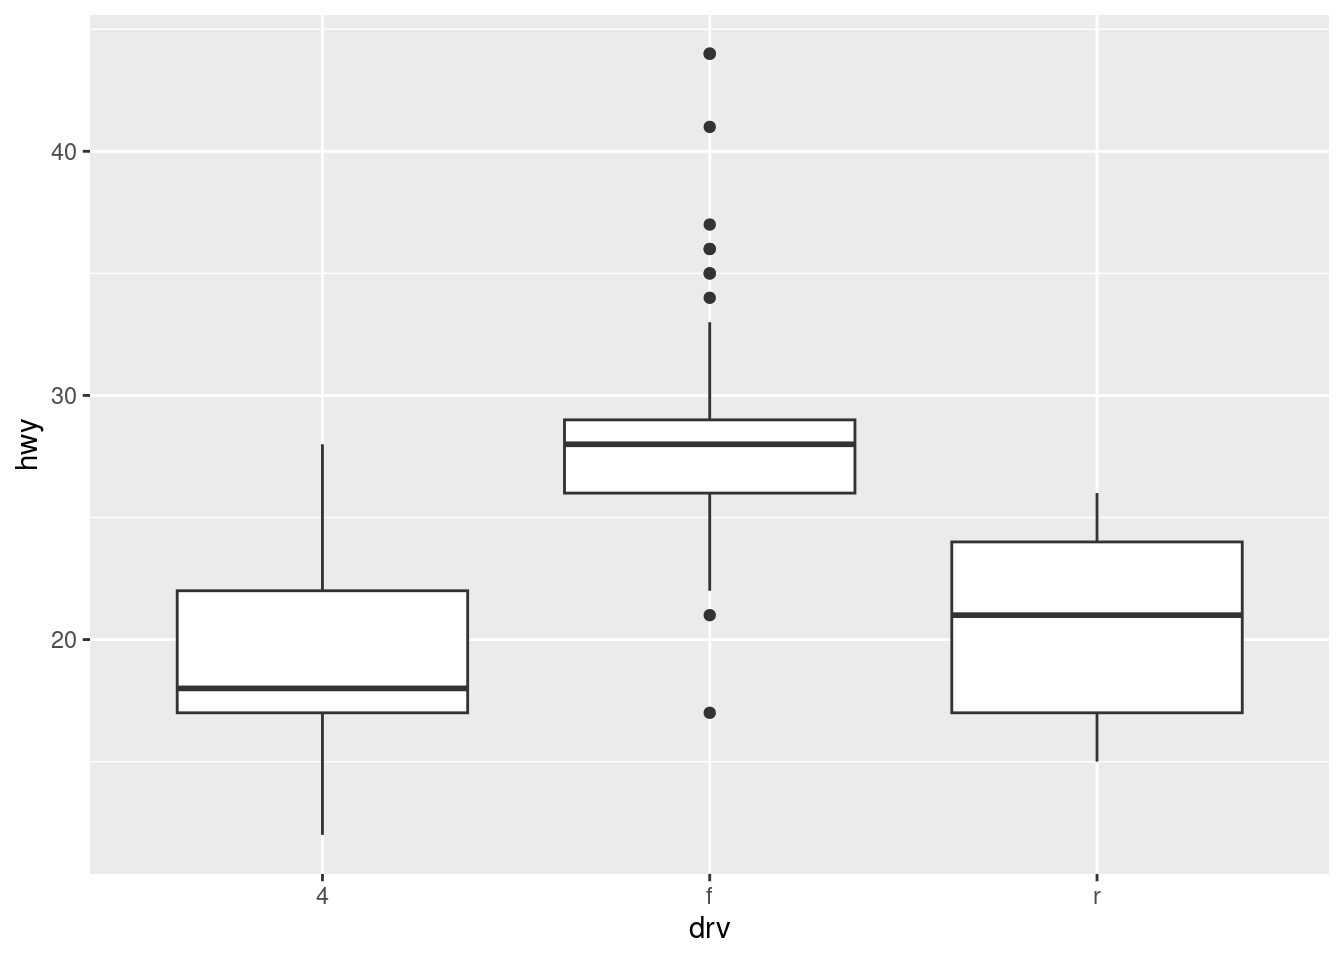
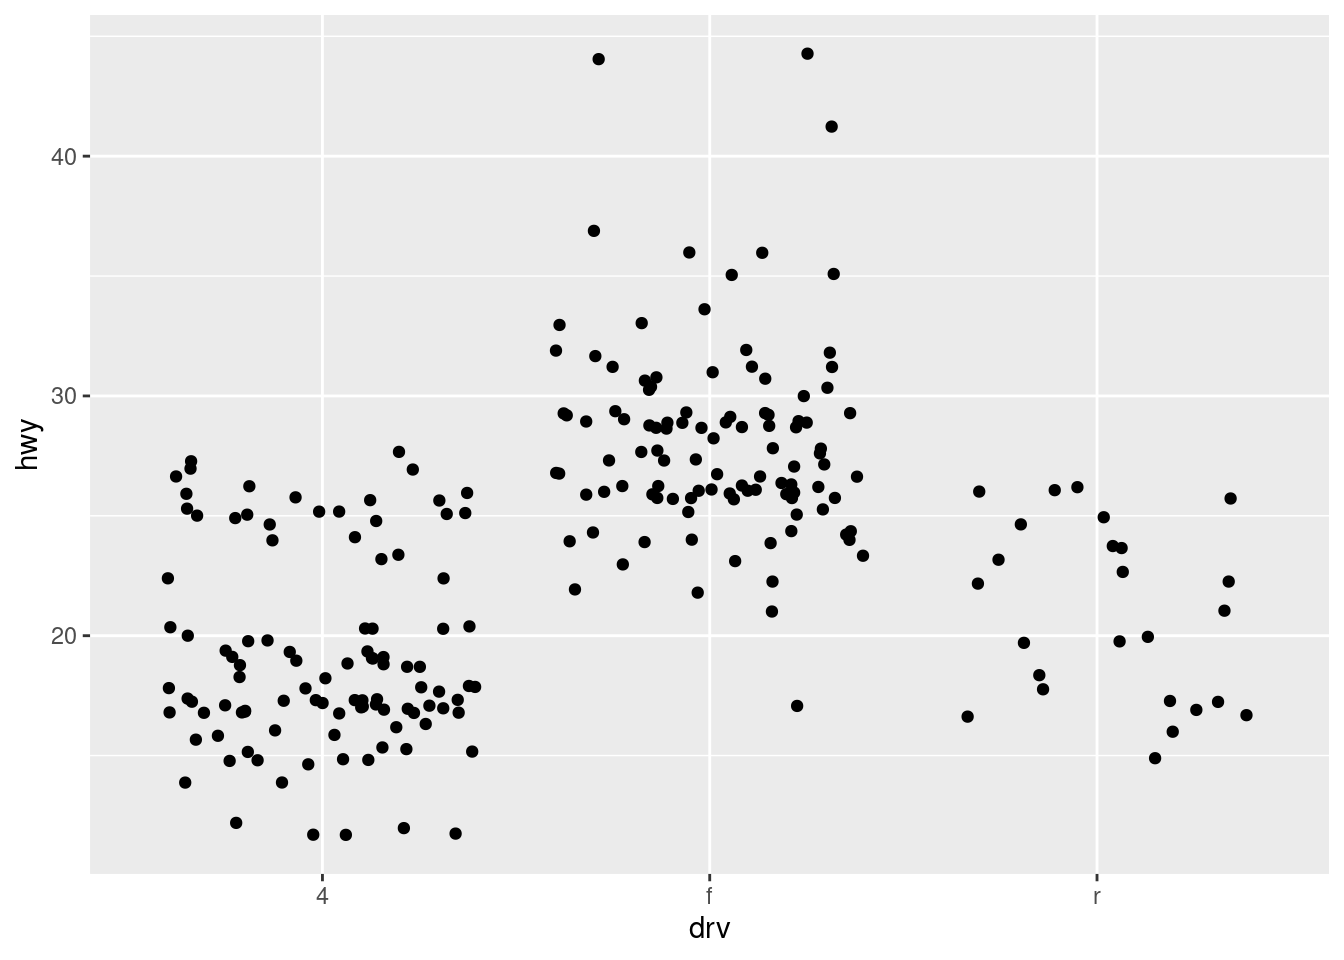
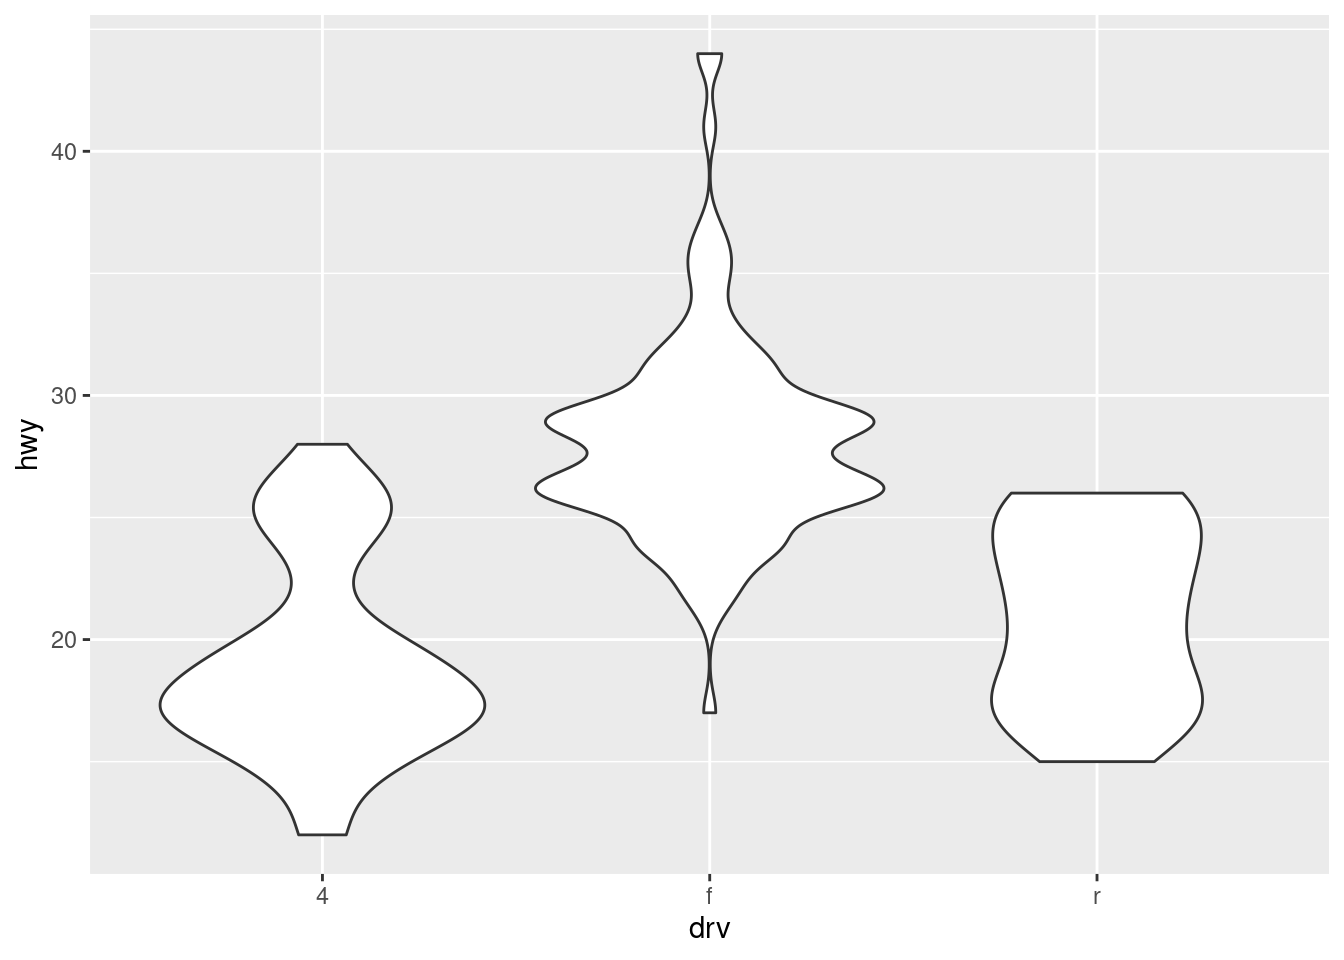
- consider boxplot variants like
geom_jitterandgeom_violin
geom_histogramwhich generates a histogram andgeom_freqpolywhich generates a frequency polygoncheck
helpto seegeom_histogram’s arguments likepositionandbinwidth.
## `stat_bin()` using `bins = 30`. Pick better value with `binwidth`.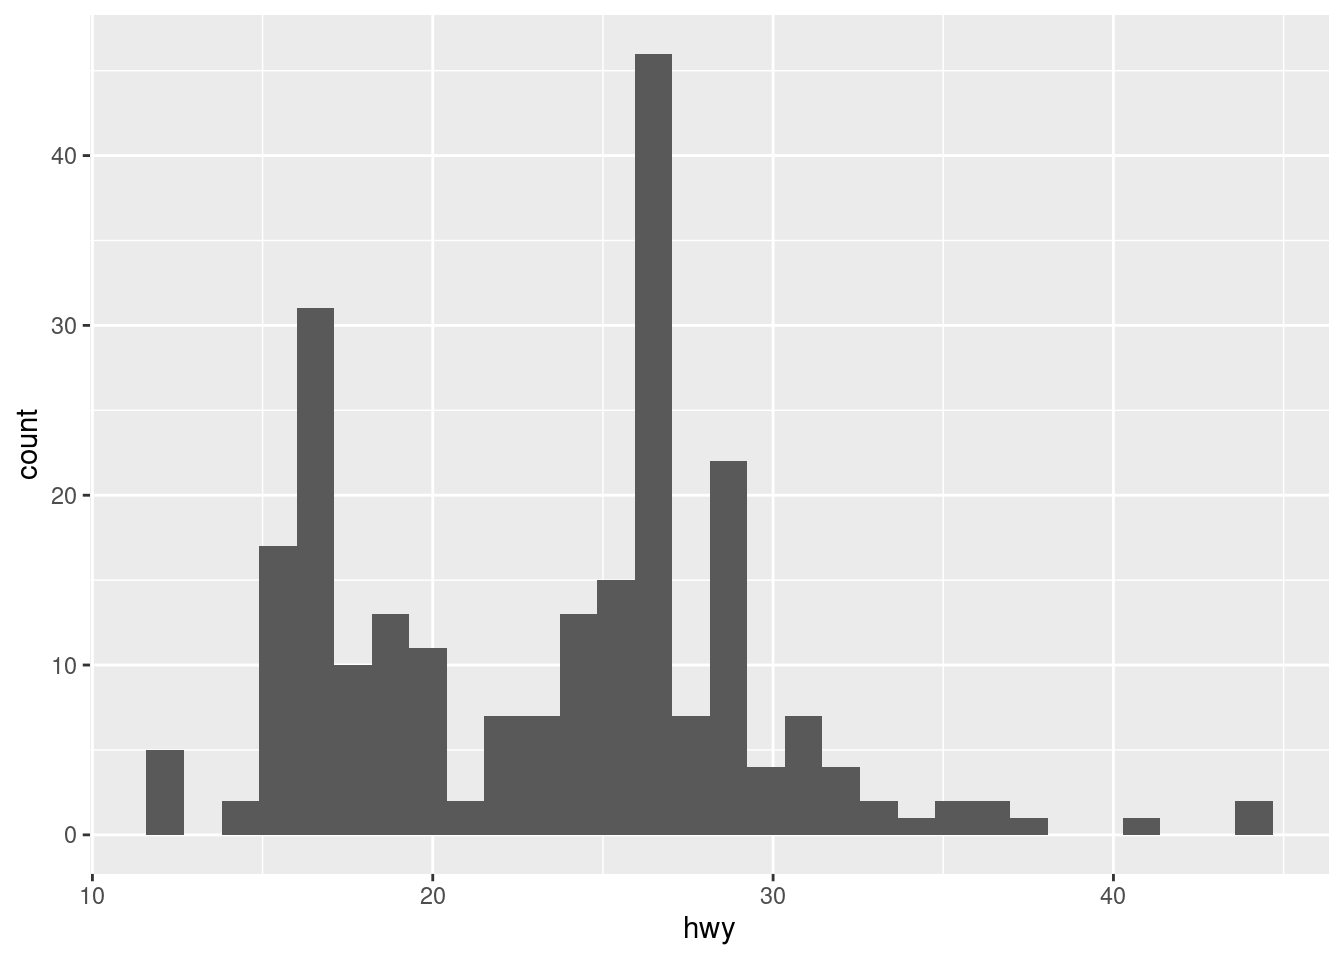
## `stat_bin()` using `bins = 30`. Pick better value with `binwidth`.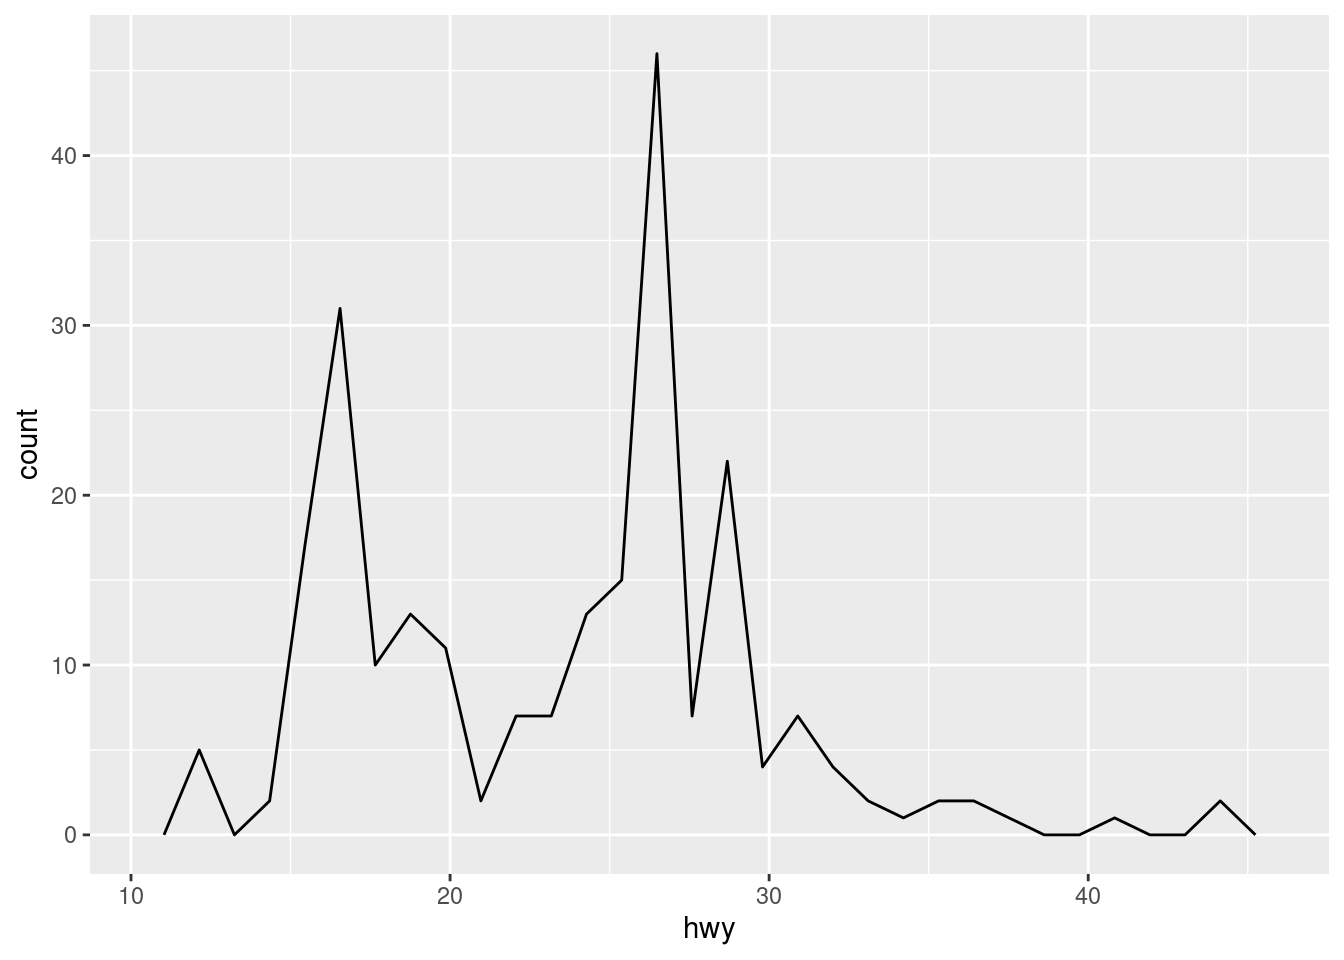
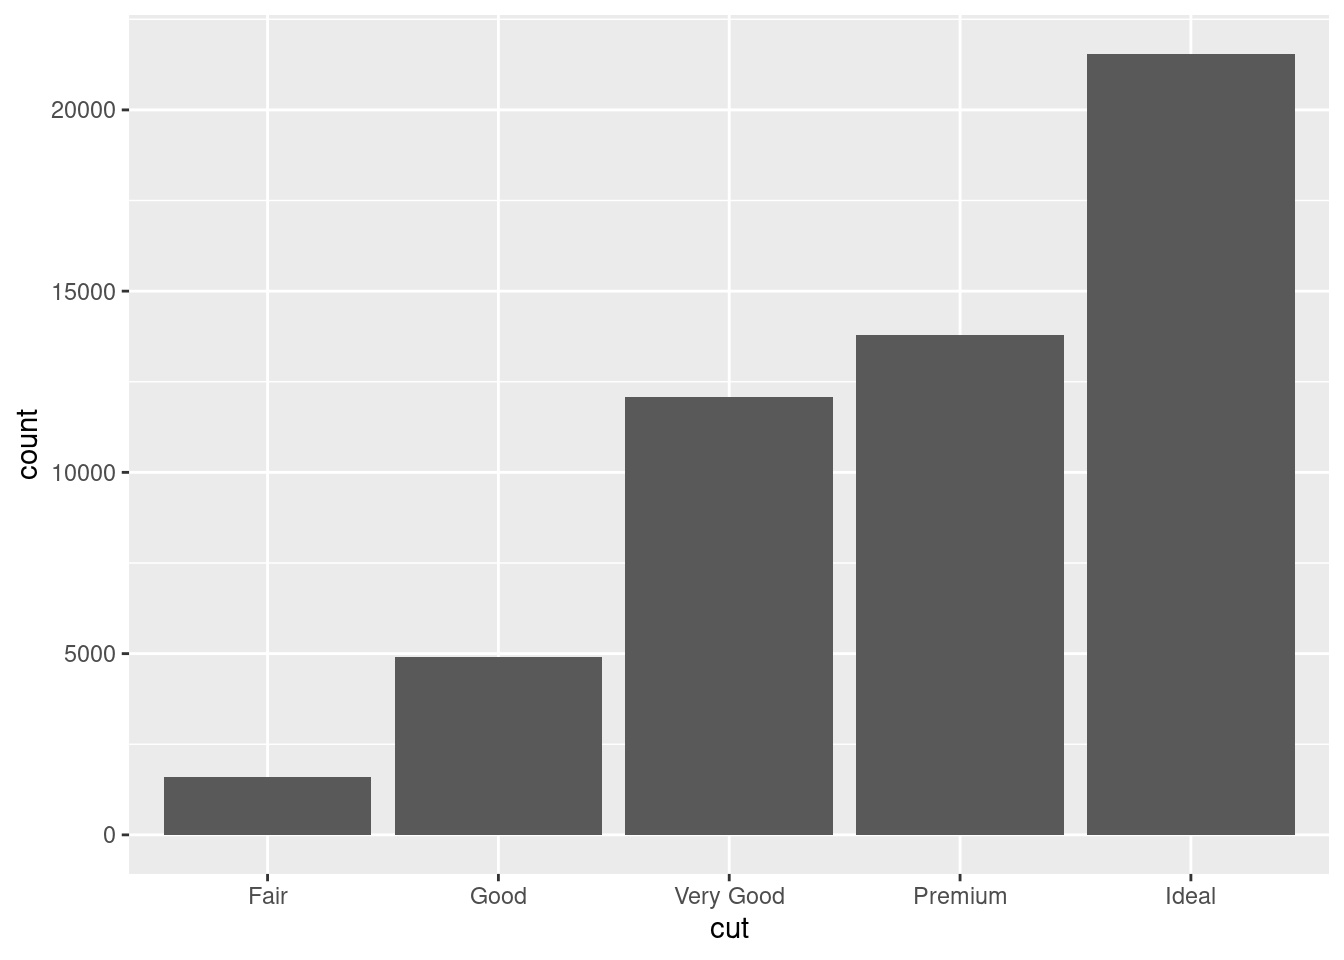
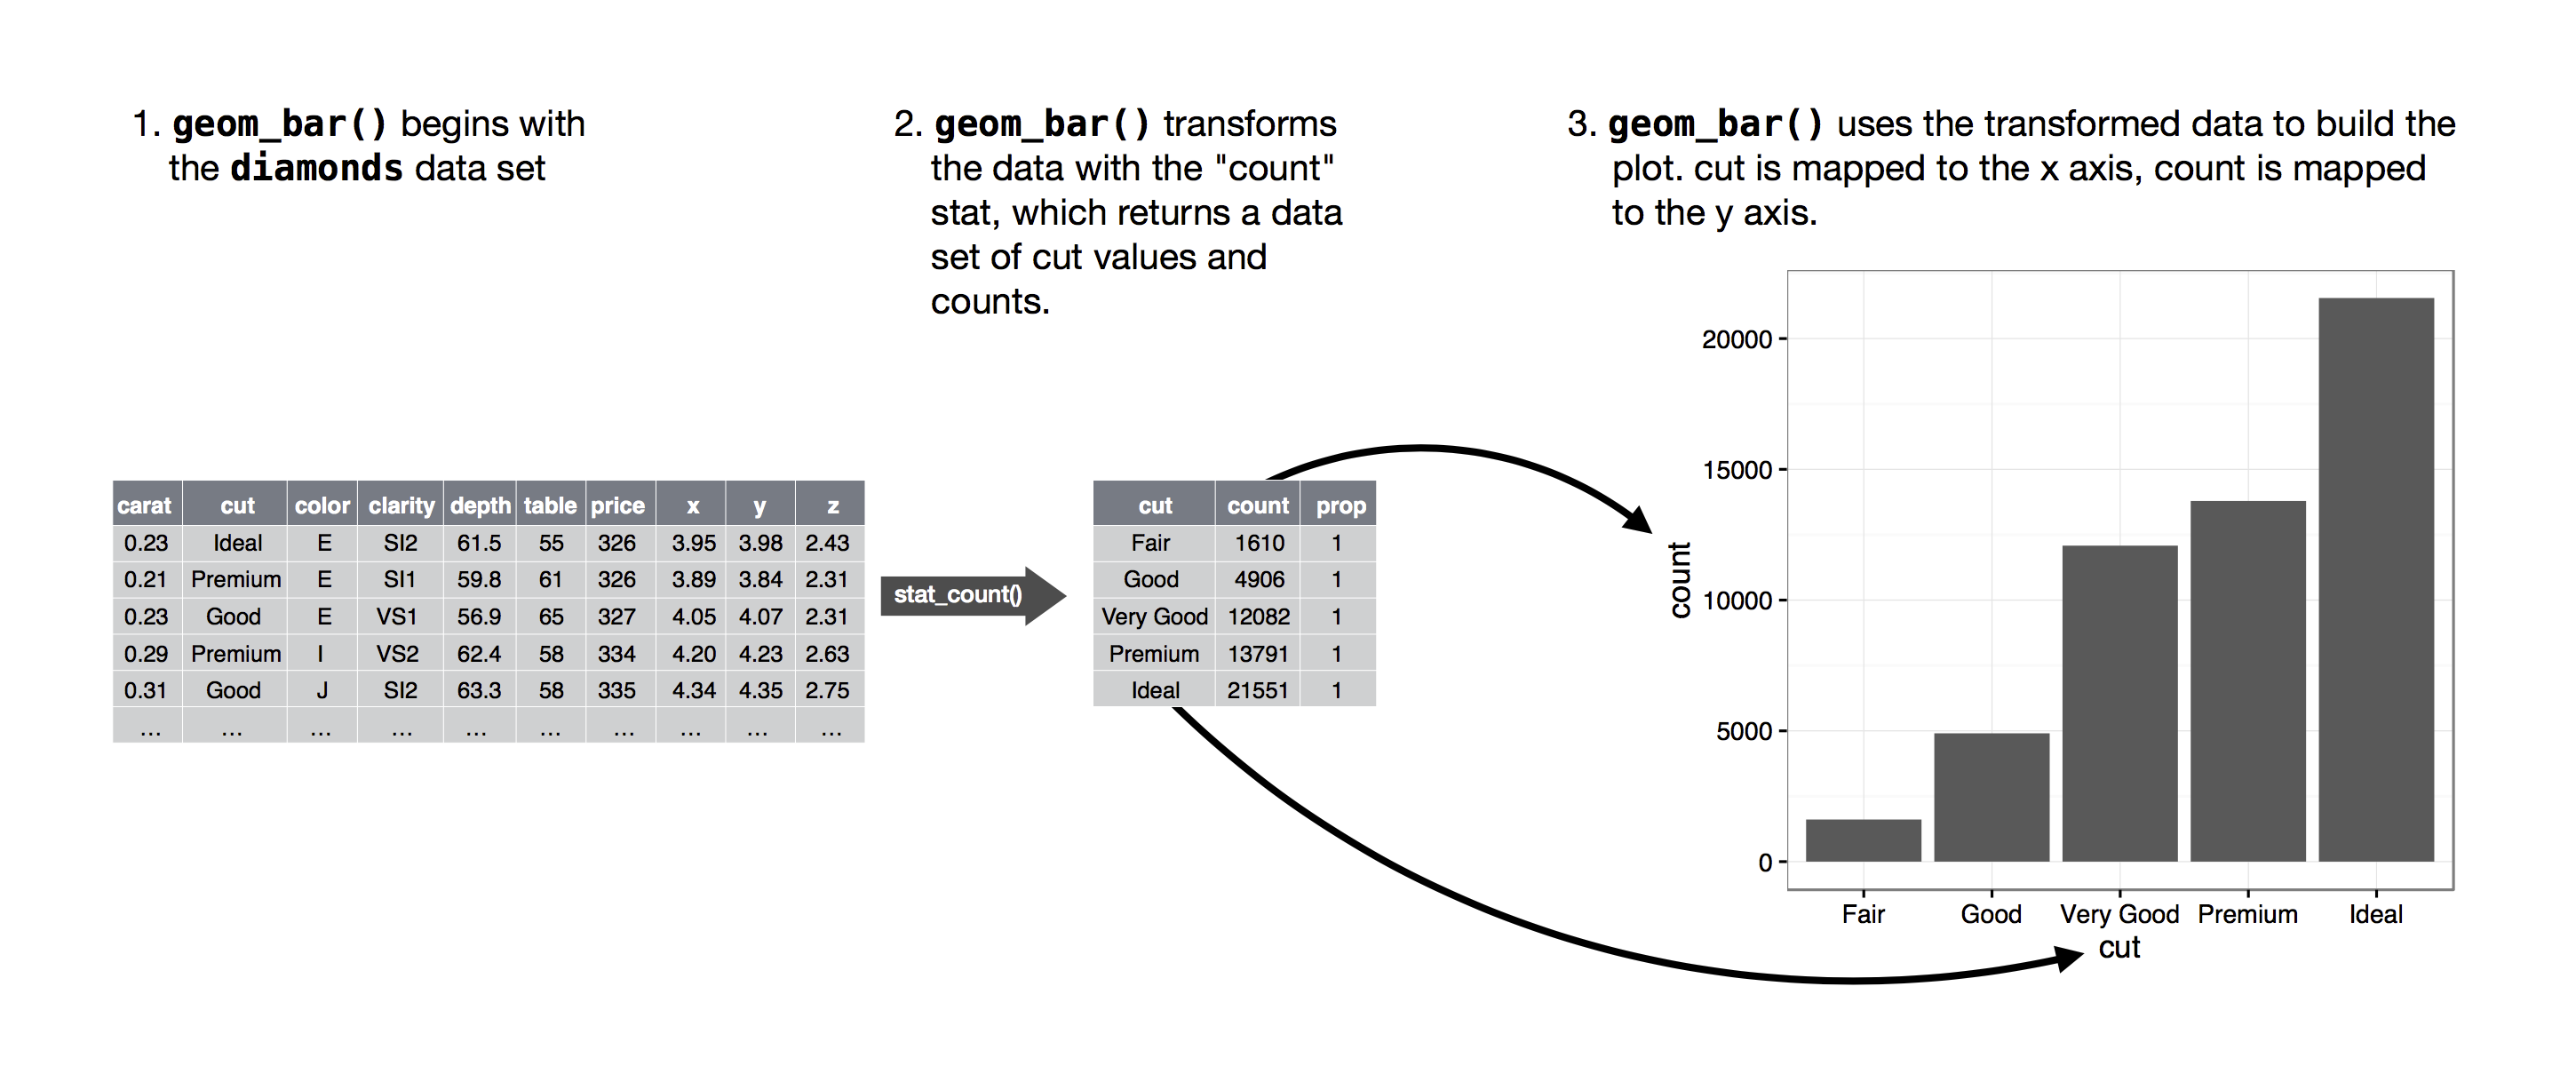
geom_barwhich generates a bar chartcheck
helpto seegeom_bar’s arguments likepositionandwidth
This graph below uses displ for y in the aesthetic and uses the stat of identity so that it sums the total displacement for each manufacturer.
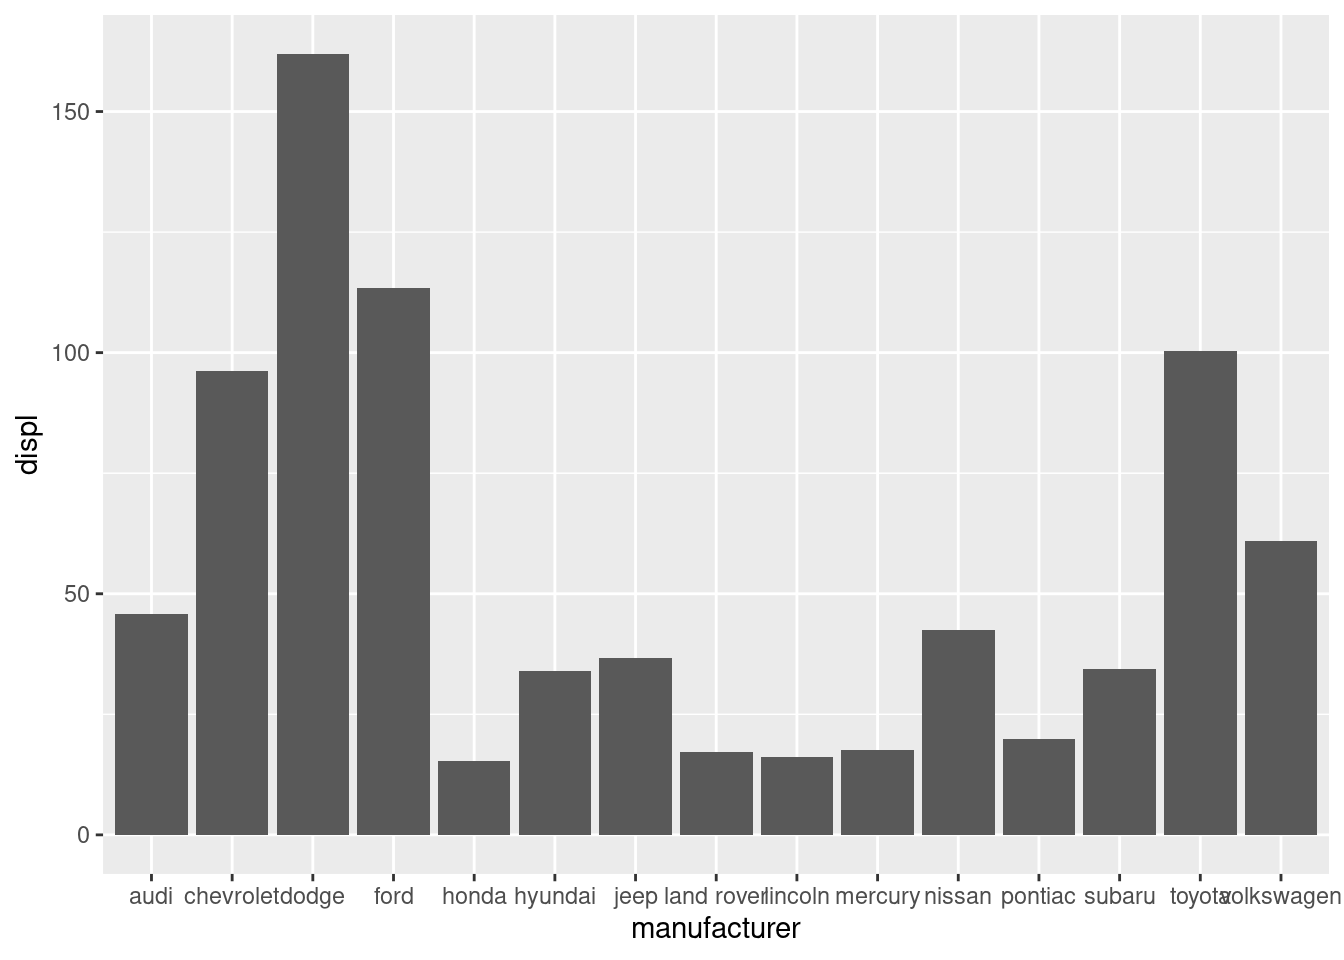
This plot now shows the total displacement.
## # A tibble: 15 × 2
##    manufacturer `sum(displ)`
##    <chr>               <dbl>
##  1 audi                 45.8
##  2 chevrolet            96.2
##  3 dodge               162
##  4 ford                113.
##  5 honda                15.4
##  6 hyundai              34
##  7 jeep                 36.6
##  8 land rover           17.2
##  9 lincoln              16.2
## 10 mercury              17.6
## 11 nissan               42.5
## 12 pontiac              19.8
## 13 subaru               34.4
## 14 toyota              100.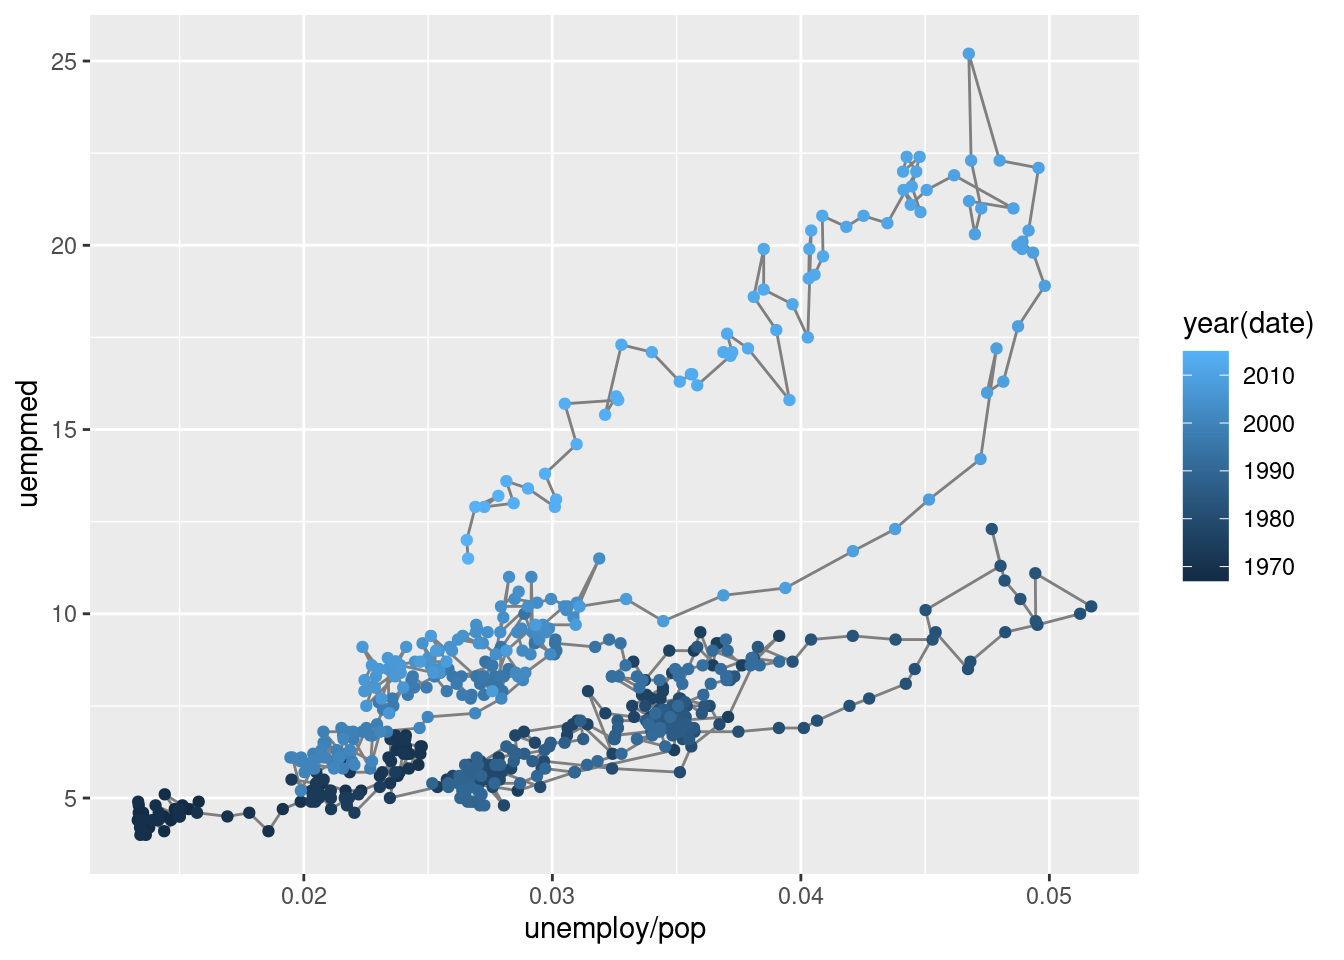
## 15 volkswagen 60.9geom_lineandgeom_pathwhich generates a line chart or path chart (useful for time series data)- check
helpto seegeom_line’s arguments likelineendandarrow
- check
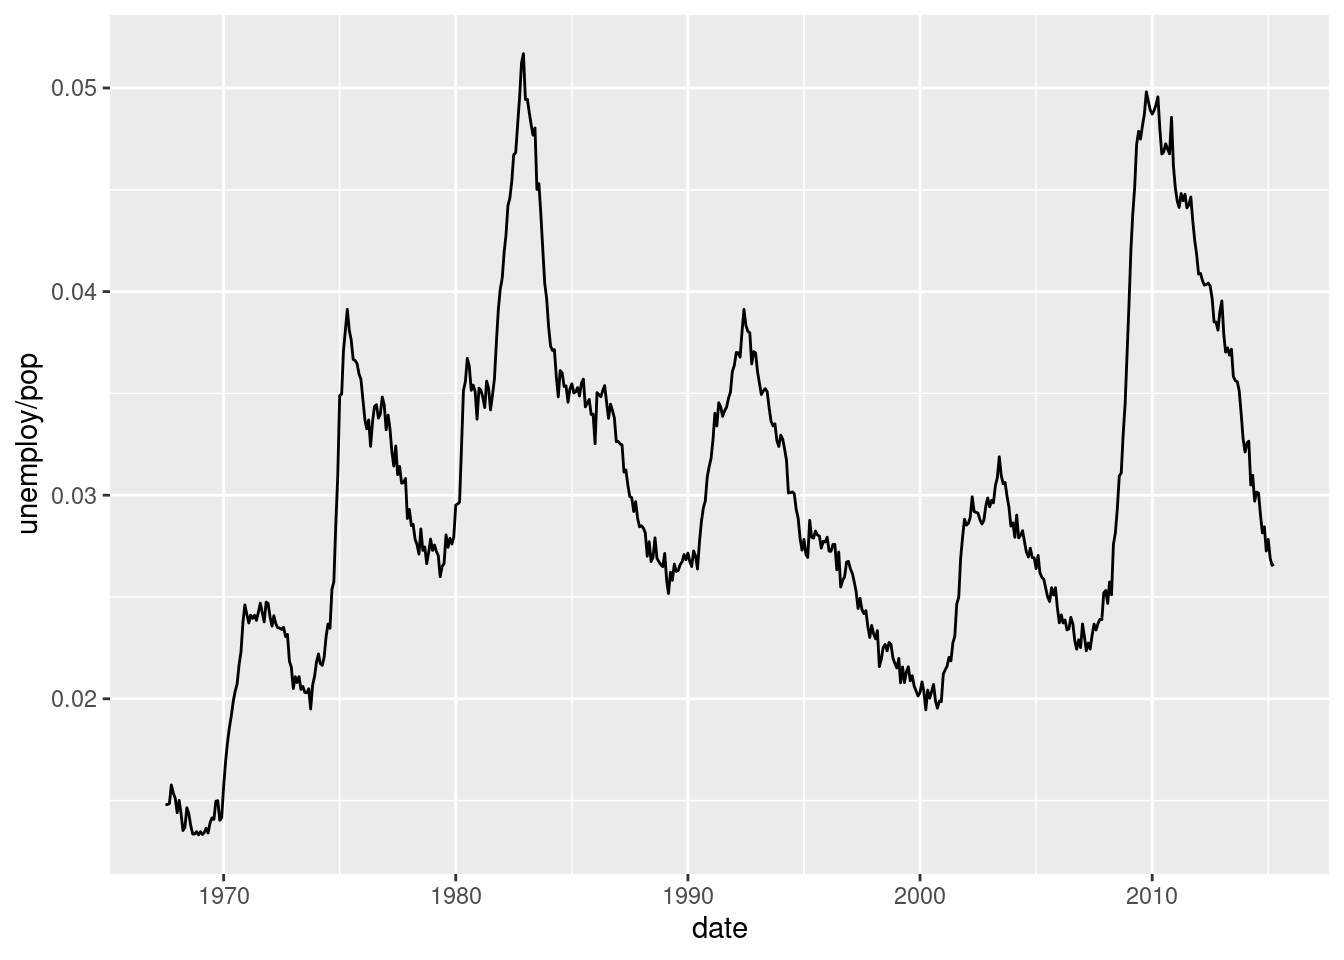
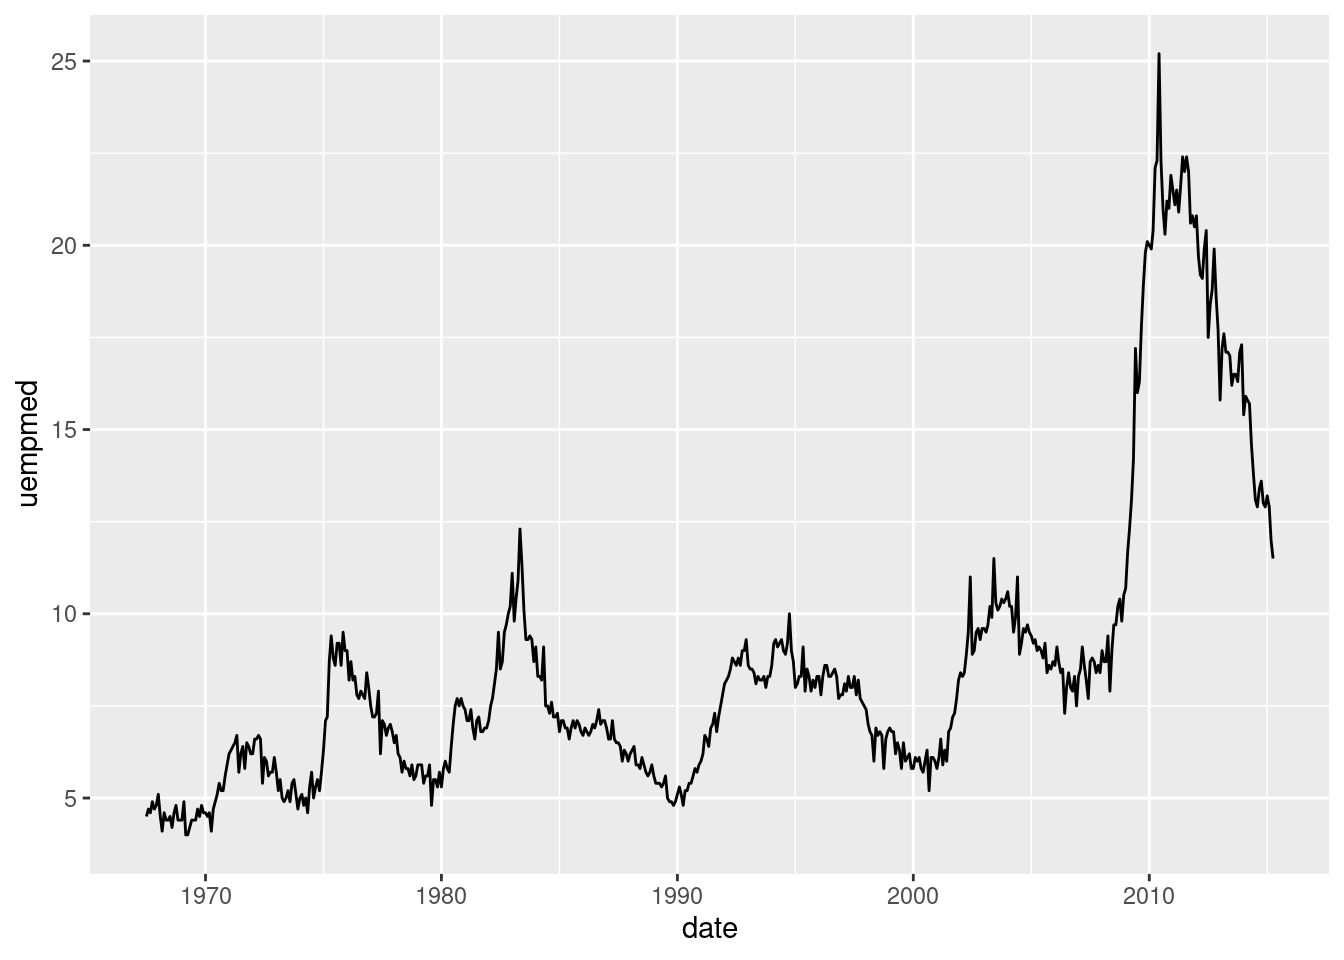
- To investigate these plots further, we can draw them on the same plot.
year <- function(x) as.POSIXlt(x)$year + 1900


ggplot(economics, aes(unemploy / pop, uempmed)) +
  geom_path(color = "grey50") +
  geom_point(aes(color = year(date)))