12.4 Manual scales
Manual scales are just a list of valid values that are mapped to the unique discrete values. If you want to customize these scales, you need to create your own new scale with the “manual” version of each: scale_linetype_manual(), scale_shape_manual(), scale_colour_manual(), etc.
The manual scale has one important argument, values, where you specify the values that the scale should produce if this vector is named, it will match the values of the output to the values of the input; otherwise it will match in order of the levels of the discrete variable. You will need some knowledge of the valid aesthetic values, which are described in vignette(“ggplot2-specs”).
Manual scales have appeared earlier, in Sections 11.3.4 and 12.2.
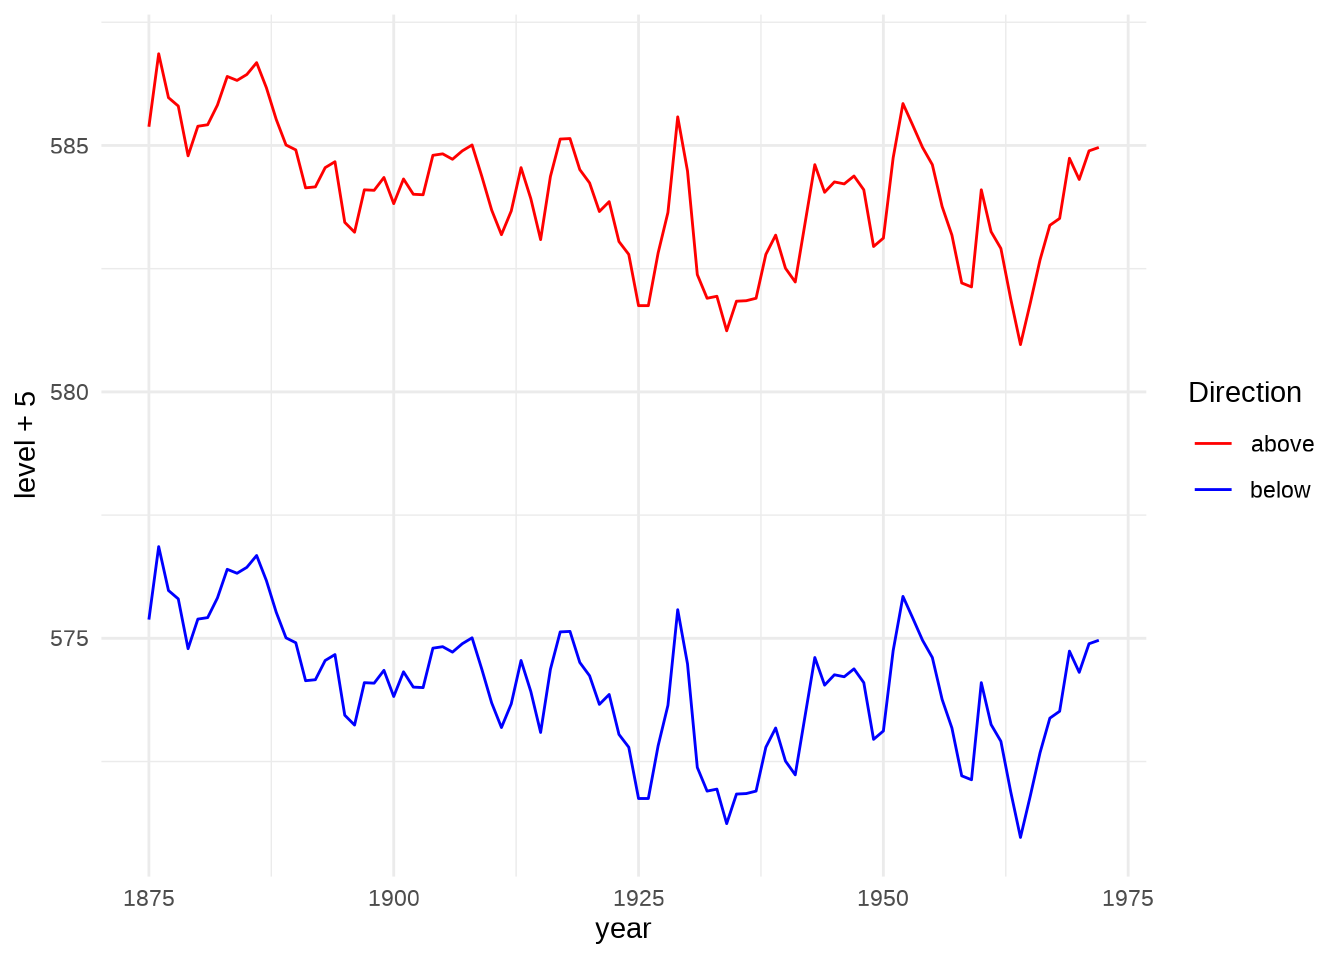
In the following example, you’ll see a creative use of scale_colour_manual() to display multiple variables on the same plot and show a useful legend.
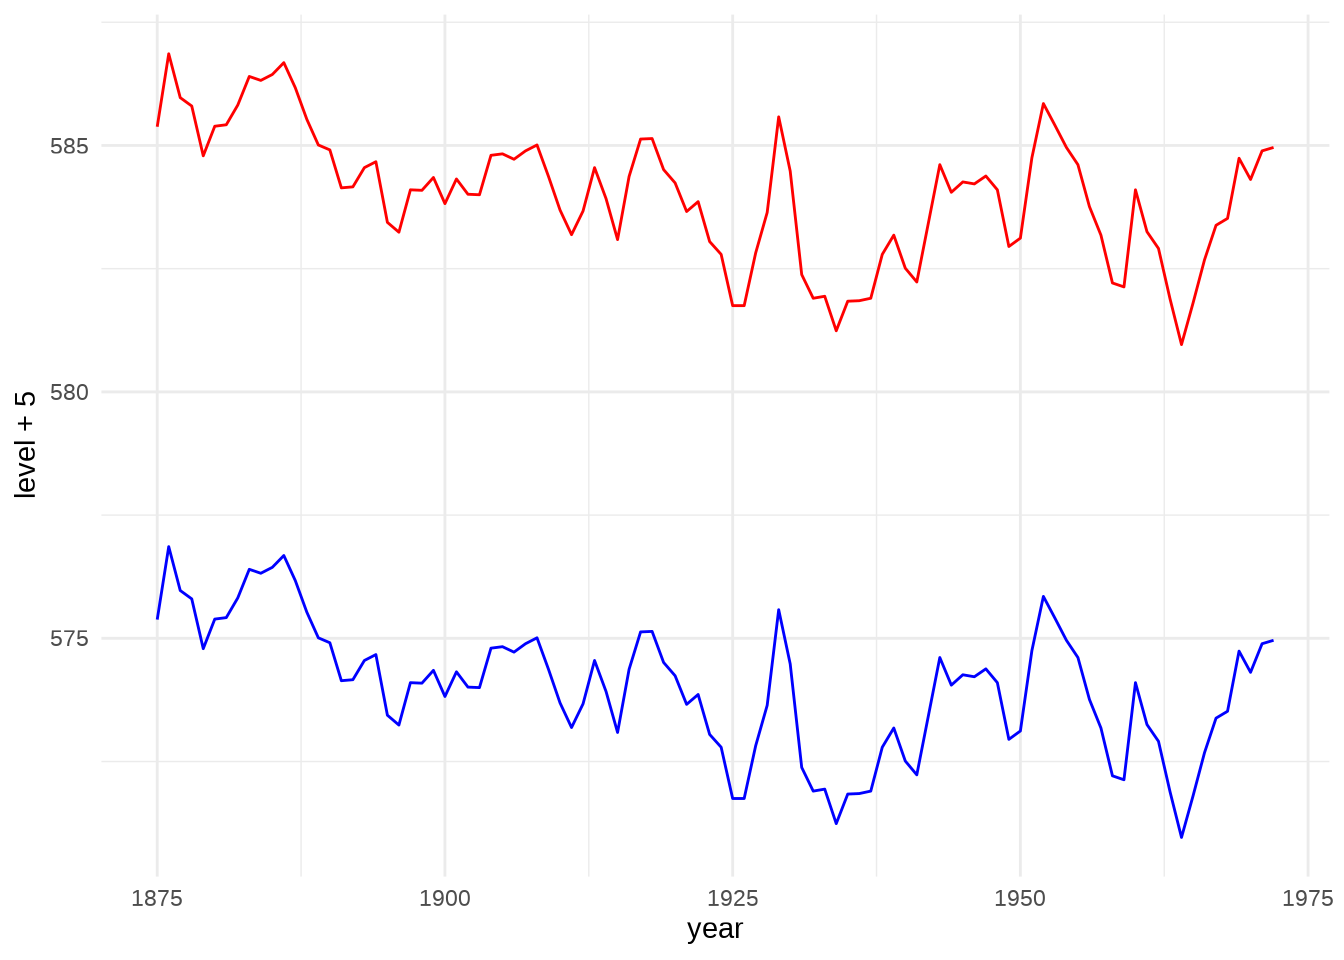
-In most plotting systems, you’d color the lines and then add a legend:

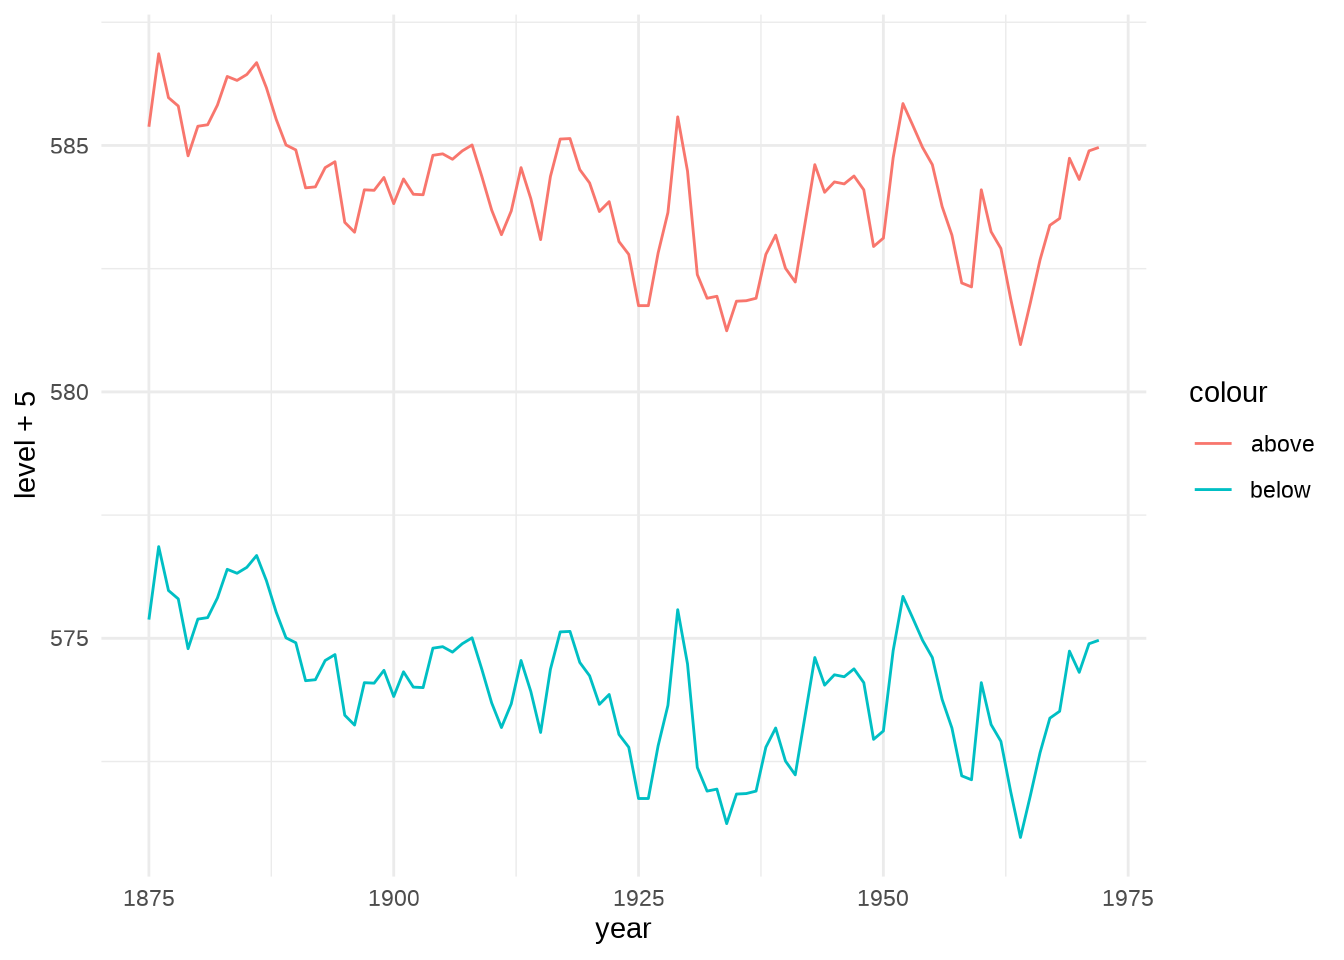
- That doesn’t work in ggplot because there’s no way to add a legend manually. Instead, give the lines informative labels:

- And then tell the scale how to map labels to colours:
