19.8 Rendering the panels
First, each layer is converted into a list of graphical objects (
grobs) …
geom_grobs <- by_layer(function(l, d) l$draw_geom(d, layout),
    plot$layers, data, "converting geom to grob")
This step draws loops through each layer, taking the layer object l and the data associated with that layer d and using the Geom from the layer to draw the data.
geom_grobs <- ggtrace_inspect_vars(
  x = p, method = ggplot2:::ggplot_gtable.ggplot_built,
  at = 7, vars = "geom_grobs"
)
geom_grobs
[[1]]
[[1]]$`1`
points[geom_point.points.31574]
[[1]]$`2`
points[geom_point.points.31576]
[[2]]
[[2]]$`1`
gTree[geom_smooth.gTree.31593]
[[2]]$`2`
gTree[geom_smooth.gTree.31610] The geom_grobs calculated at this step can also be accessed using the layer_grob() function on the ggplot object, which is similar to the layer_data() function:
[[1]]
[[1]]$`1`
points[geom_point.points.31734]

[[1]]$`2`
points[geom_point.points.31736]


[[2]]
[[2]]$`1`
gTree[geom_smooth.gTree.31753]

[[2]]$`2`
gTree[geom_smooth.gTree.31770]
Each element of geom_grobs is a list of graphical objects representing a layer’s data in a facet. For example, this draws the data plotted by the first layer in the first facet
After this, the facet takes over and assembles the panels…
The graphical representation of each layer in each facet are combined with other “non-data” elements of the plot at this step, where the plot_table variable is defined.
legend_box <- plot$guides$assemble(theme)plot_table <- ggtrace_inspect_vars(
x = p, method = ggplot2:::ggplot_gtable.ggplot_built,
at = 9, vars = "plot_table"
)plot_table is a special grob called a gtable, which is the same structure as the final form of the ggplot figure before it’s sent off to the rendering system to get drawn:
plot_table
TableGrob (6 x 9) "layout": 16 grobs
   z     cells        name                                            grob
1  1 (4-4,3-3)   panel-1-1                      gTree[panel-1.gTree.31822]
2  1 (4-4,7-7)   panel-2-1                      gTree[panel-2.gTree.31836]
3  3 (2-2,3-3)  axis-t-1-1                                  zeroGrob[NULL]
4  3 (2-2,7-7)  axis-t-2-1                                  zeroGrob[NULL]
5  3 (5-5,3-3)  axis-b-1-1           absoluteGrob[GRID.absoluteGrob.31839]
6  3 (5-5,7-7)  axis-b-2-1           absoluteGrob[GRID.absoluteGrob.31839]
7  3 (4-4,6-6)  axis-l-1-2                                  zeroGrob[NULL]
8  3 (4-4,2-2)  axis-l-1-1           absoluteGrob[GRID.absoluteGrob.31845]
9  3 (4-4,8-8)  axis-r-1-2                                  zeroGrob[NULL]
10 3 (4-4,4-4)  axis-r-1-1                                  zeroGrob[NULL]
11 2 (3-3,3-3) strip-t-1-1                                   gtable[strip]
12 2 (3-3,7-7) strip-t-2-1                                   gtable[strip]
13 4 (1-1,3-7)      xlab-t                                  zeroGrob[NULL]
14 5 (6-6,3-7)      xlab-b titleGrob[axis.title.x.bottom..titleGrob.31895]
15 6 (4-4,1-1)      ylab-l   titleGrob[axis.title.y.left..titleGrob.31898]
16 7 (4-4,9-9)      ylab-r                                  zeroGrob[NULL]
When it is first defined, it’s only a partially complete representation of the plot - title, legend, margins, etc. are missing:
Recall that plot_table is the output of layout$render:
legend_box <- plot$guides$assemble(theme)This is the load-bearing step that computes/defines a bunch of smaller components internally:
<ggproto method>
  <Wrapper function>
    function (...)
render(..., self = self)

  <Inner function (f)>
    function (self, panels, data, theme, labels)
{
    facet_bg <- self$facet$draw_back(data, self$layout, self$panel_scales_x,
        self$panel_scales_y, theme, self$facet_params)
    facet_fg <- self$facet$draw_front(data, self$layout, self$panel_scales_x,
        self$panel_scales_y, theme, self$facet_params)
    panels <- lapply(seq_along(panels[[1]]), function(i) {
        panel <- lapply(panels, `[[`, i)
        panel <- c(facet_bg[i], panel, facet_fg[i])
        coord_fg <- self$coord$render_fg(self$panel_params[[i]],
            theme)
        coord_bg <- self$coord$render_bg(self$panel_params[[i]],
            theme)
        if (isTRUE(theme$panel.ontop)) {
            panel <- c(panel, list(coord_bg), list(coord_fg))
        }
        else {
            panel <- c(list(coord_bg), panel, list(coord_fg))
        }
        ggname(paste("panel", i, sep = "-"), gTree(children = inject(gList(!!!panel))))
    })
    plot_table <- self$facet$draw_panels(panels, self$layout,
        self$panel_scales_x, self$panel_scales_y, self$panel_params,
        self$coord, data, theme, self$facet_params)
    labels <- self$coord$labels(list(x = self$resolve_label(self$panel_scales_x[[1]],
        labels), y = self$resolve_label(self$panel_scales_y[[1]],
        labels)), self$panel_params[[1]])
    labels <- self$render_labels(labels, theme)
    self$facet$draw_labels(plot_table, self$layout, self$panel_scales_x,
        self$panel_scales_y, self$panel_params, self$coord, data,
        theme, labels, self$params)
}
We can inspect these individual components:
[[1]]
zeroGrob[NULL]

[[2]]
zeroGrob[NULL] [[1]]
zeroGrob[NULL]
[[2]]
zeroGrob[NULL] [[1]]
gTree[panel-1.gTree.31982]
[[2]]
gTree[panel-2.gTree.31996] TableGrob (4 x 7) "layout": 12 grobs
z cells name grob
1 1 (3-3,2-2) panel-1-1 gTree[panel-1.gTree.31982]
2 1 (3-3,6-6) panel-2-1 gTree[panel-2.gTree.31996]
3 3 (1-1,2-2) axis-t-1-1 zeroGrob[NULL]
4 3 (1-1,6-6) axis-t-2-1 zeroGrob[NULL]
5 3 (4-4,2-2) axis-b-1-1 absoluteGrob[GRID.absoluteGrob.31999]
6 3 (4-4,6-6) axis-b-2-1 absoluteGrob[GRID.absoluteGrob.31999]
7 3 (3-3,5-5) axis-l-1-2 zeroGrob[NULL]
8 3 (3-3,1-1) axis-l-1-1 absoluteGrob[GRID.absoluteGrob.32005]
9 3 (3-3,7-7) axis-r-1-2 zeroGrob[NULL]
10 3 (3-3,3-3) axis-r-1-1 zeroGrob[NULL]
11 2 (2-2,2-2) strip-t-1-1 gtable[strip]
12 2 (2-2,6-6) strip-t-2-1 gtable[strip]$x
$x[[1]]
zeroGrob[NULL]
$x[[2]]
titleGrob[axis.title.x.bottom..titleGrob.32055]
$y
$y[[1]]
titleGrob[axis.title.y.left..titleGrob.32058]
$y[[2]]
zeroGrob[NULL] 19.8.0.1 Sneak peak:
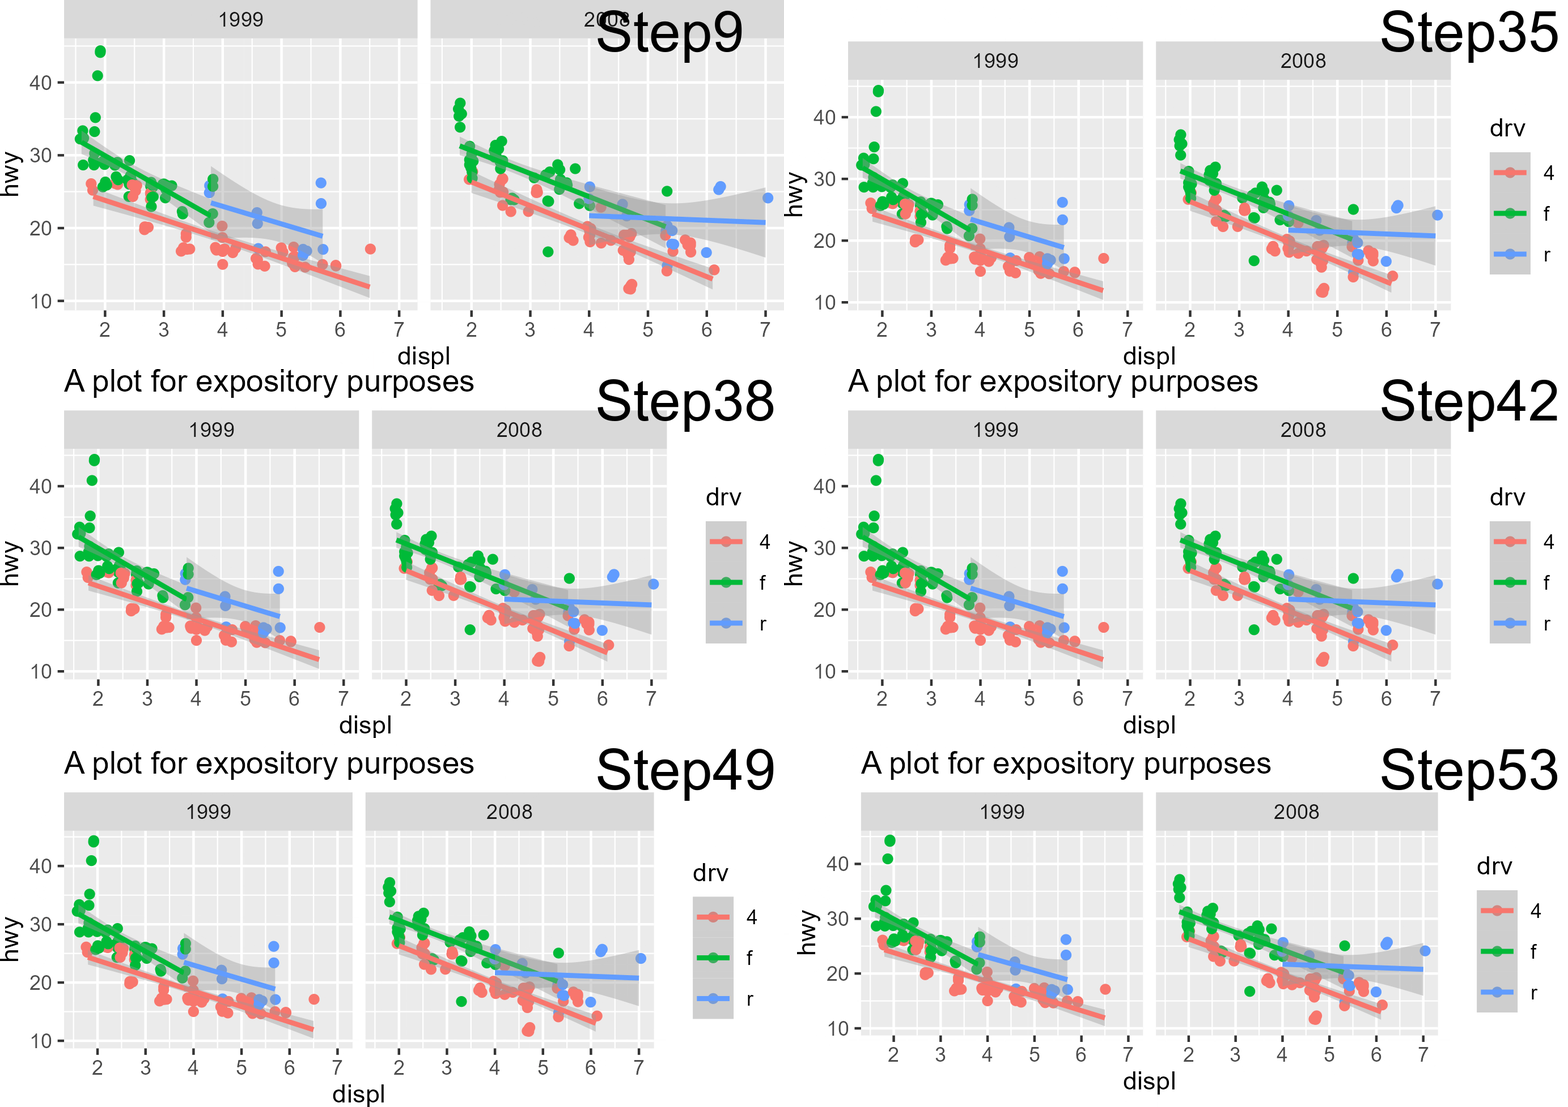
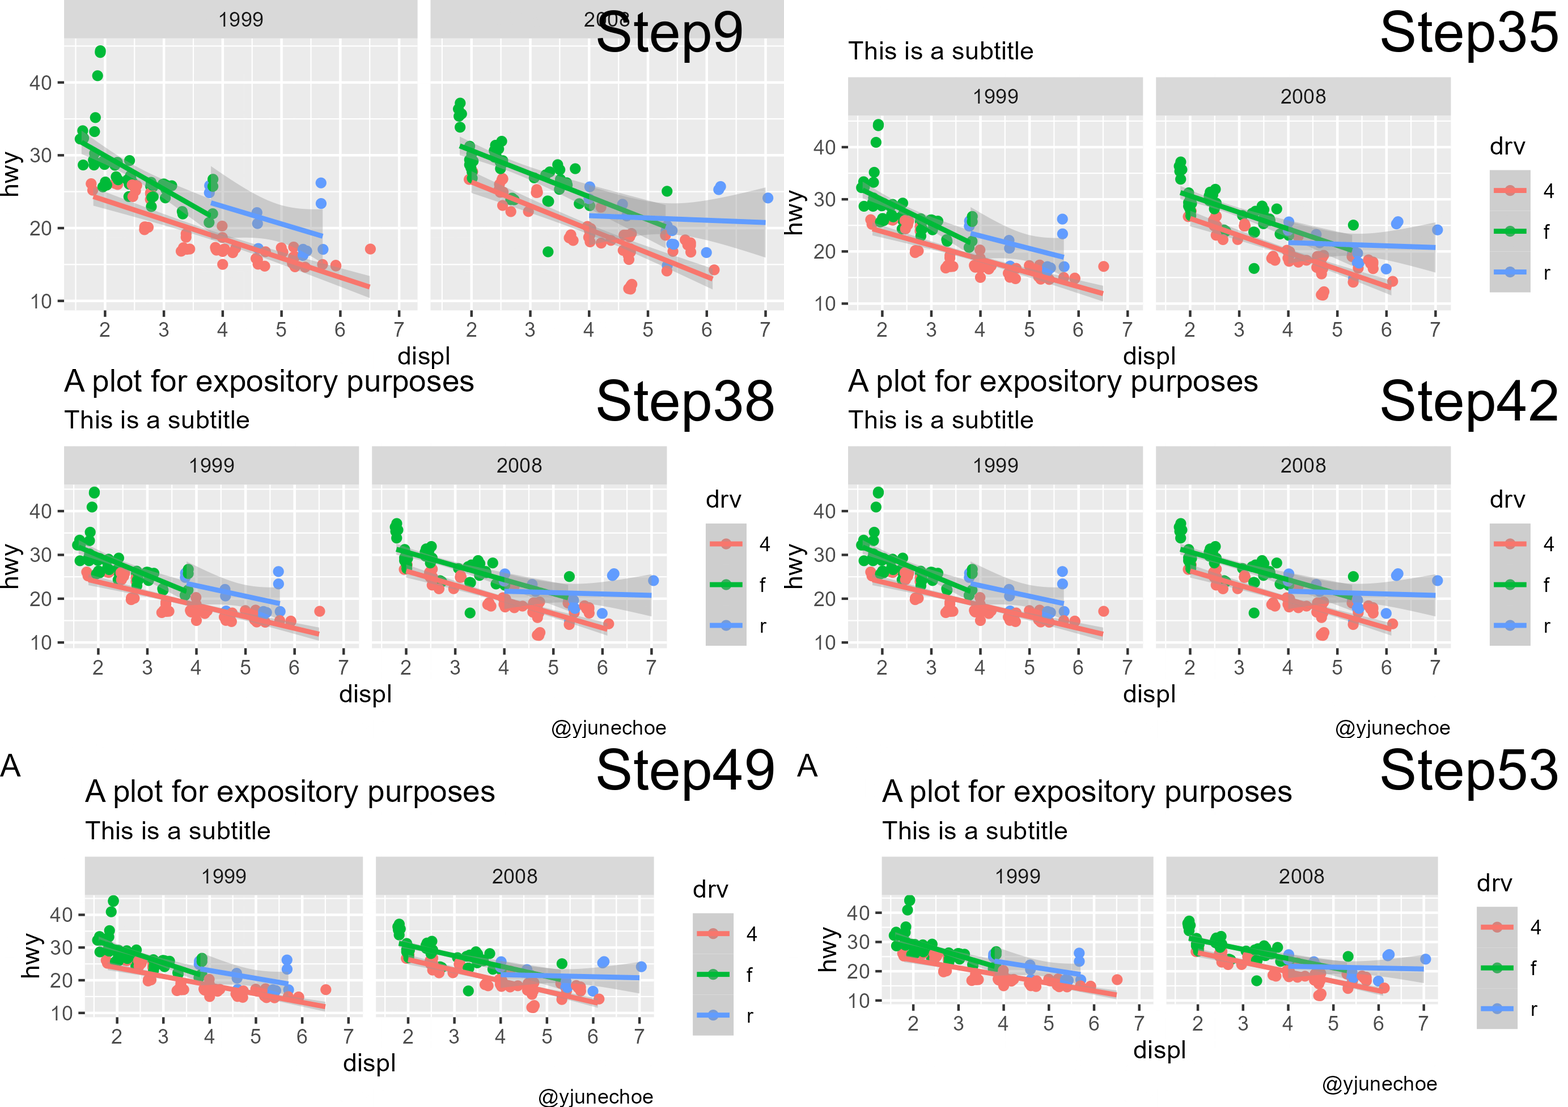
The rest of the gtable step is just updating this plot_table object.
all_plot_table_versions <- ggtrace_inspect_vars(
  x = p, method = ggplot2:::ggplot_gtable.ggplot_built,
  at = "all", vars = "plot_table"
)
names(all_plot_table_versions)
[1] "Step8" "Step10" "Step22" "Step23" "Step24" "Step25" "Step26" "Step27"
[9] "Step28" "Step29" "Step30" "Step31" "Step32" "Step33" "Step34"lapply(seq_along(all_plot_table_versions), function(i) {
ggsave(tempfile(sprintf("plot_table_%02d_", i), fileext = ".png"), all_plot_table_versions[[i]])
})
dir(tempdir(), "plot_table_.*png", full.names = TRUE) %>%
magick::image_read() %>%
magick::image_annotate(names(all_plot_table_versions), location = "+1050+0", size = 100) %>%
magick::image_write_gif("images/plot_table_animation1.gif", delay = .5)
all_plot_table_versions2 <- ggtrace_inspect_vars(
  x = p +
    labs(
      subtitle = "This is a subtitle",
      caption = "@yjunechoe",
      tag = "A"
    )
  ,
  method = ggplot2:::ggplot_gtable.ggplot_built,
  at = "all", vars = "plot_table"
)
identical(names(all_plot_table_versions), names(all_plot_table_versions2))
lapply(seq_along(all_plot_table_versions2), function(i) {
  ggsave(tempfile(sprintf("plot_table2_%02d_", i), fileext = ".png"), all_plot_table_versions2[[i]])
})
dir(tempdir(), "plot_table2_.*png", full.names = TRUE) %>%
  magick::image_read() %>%
  magick::image_annotate(names(all_plot_table_versions), location = "+1050+0", size = 100) %>%
  magick::image_write_gif("images/plot_table_animation2.gif", delay = .5)