Breaks
Axis tick marks and legend tick marks are special cases of scale breaks ->
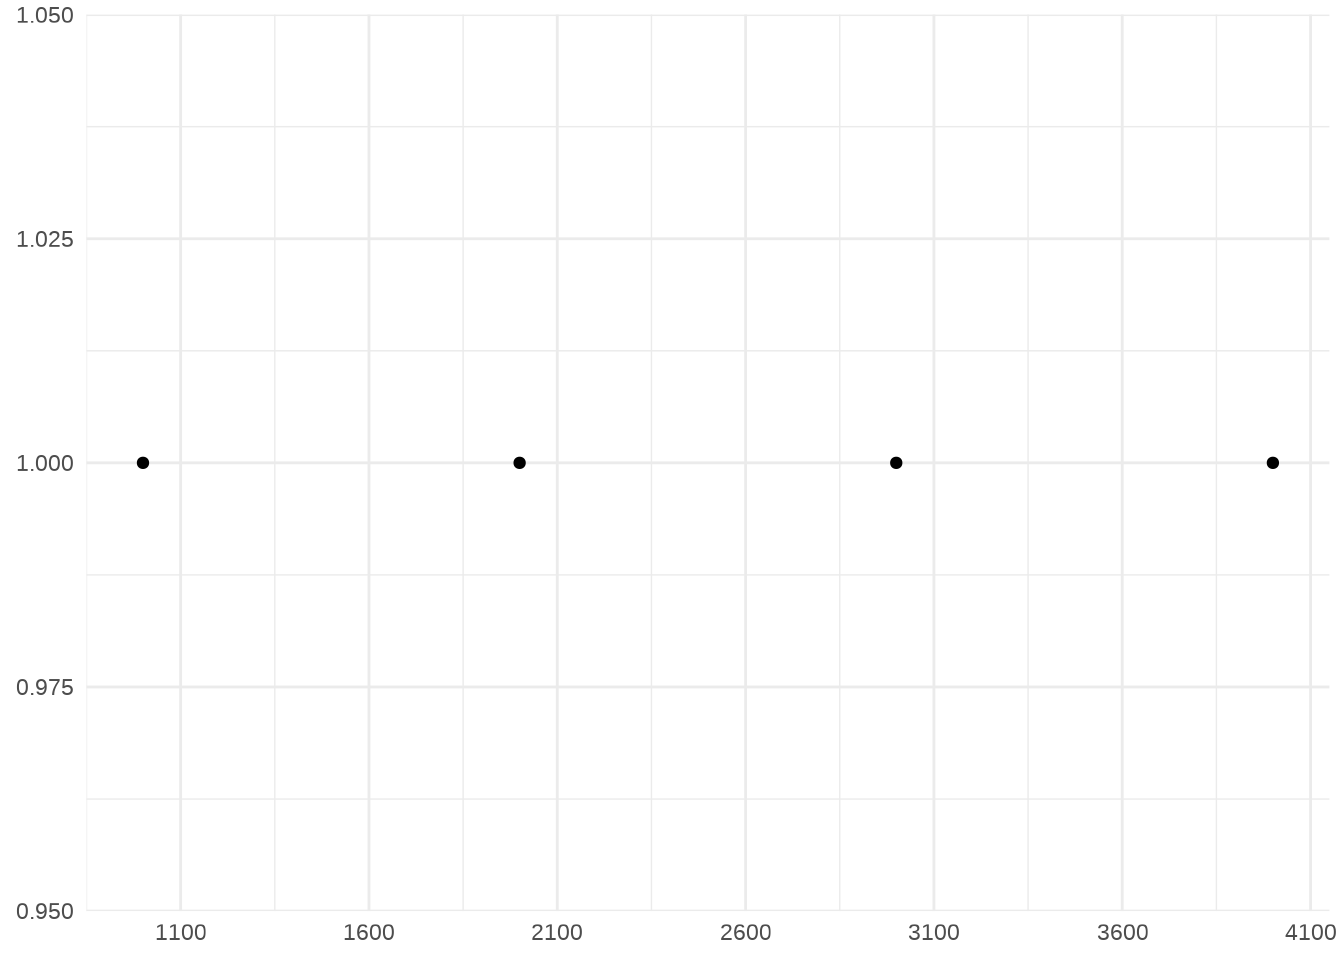
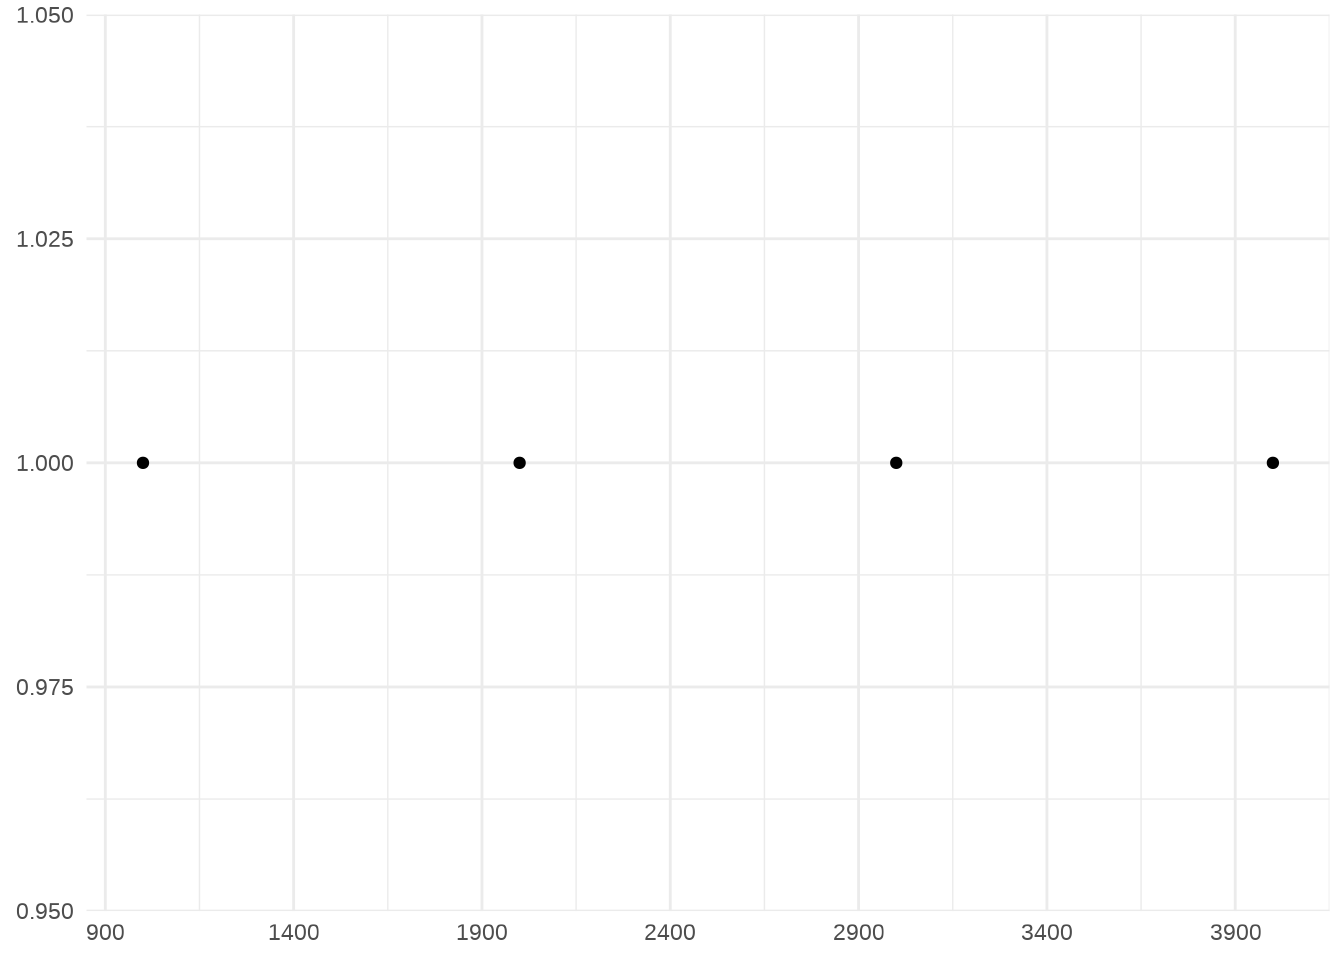
breaksargument in thescale_*()function.Let’s see an example:
##   const up txt  big  log
## 1     1  1   a 1000    2
## 2     1  2   b 2000    5
## 3     1  3   c 3000   10
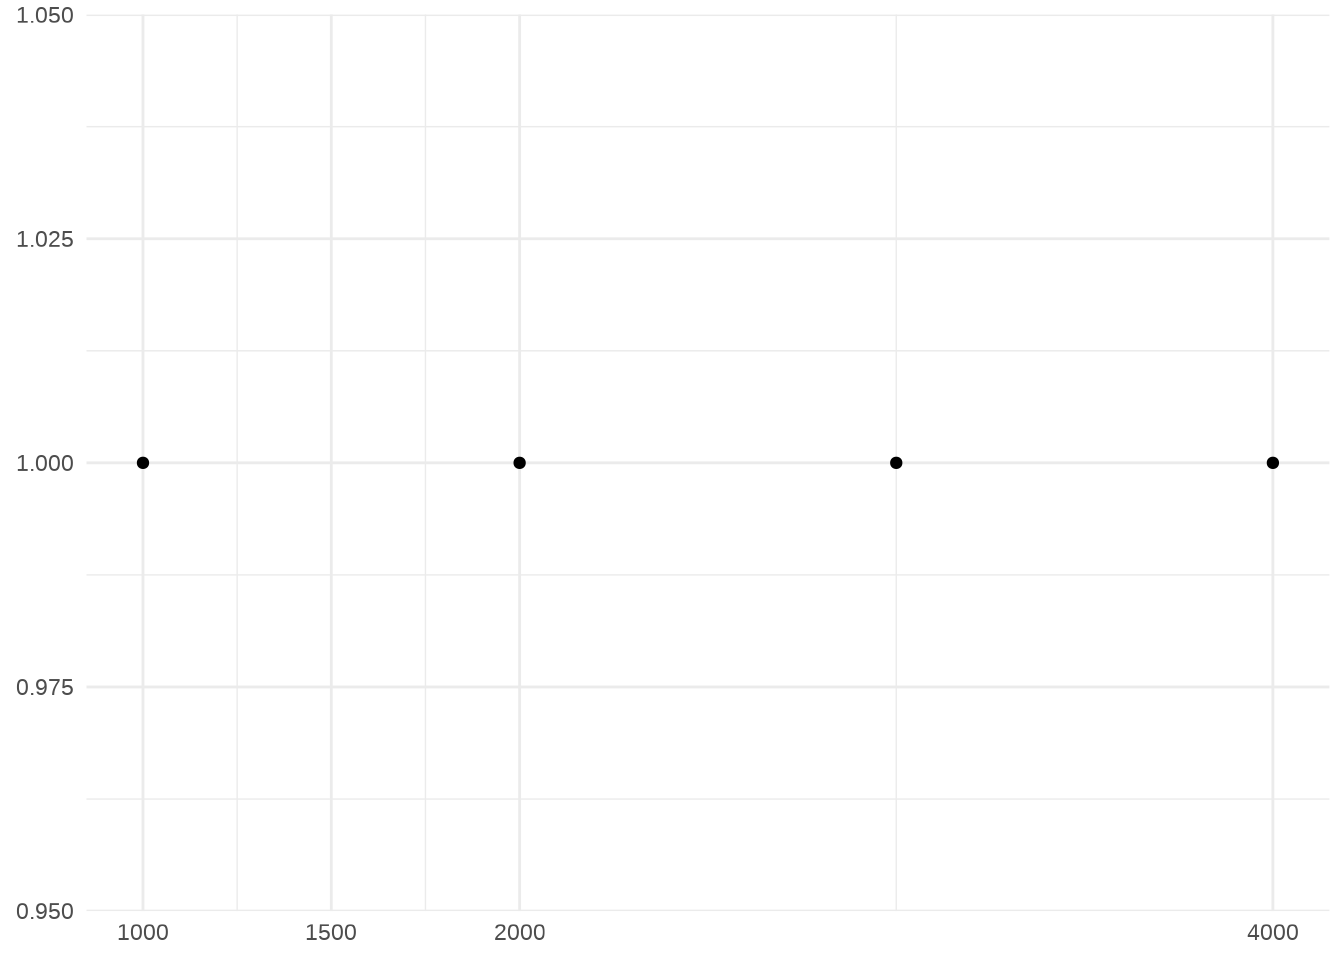
## 4 1 4 d 4000 2000- To set breaks manually, pass a vector of data values to
breaksor setbreaks = NULLto remove them and the corresponding tick marks.

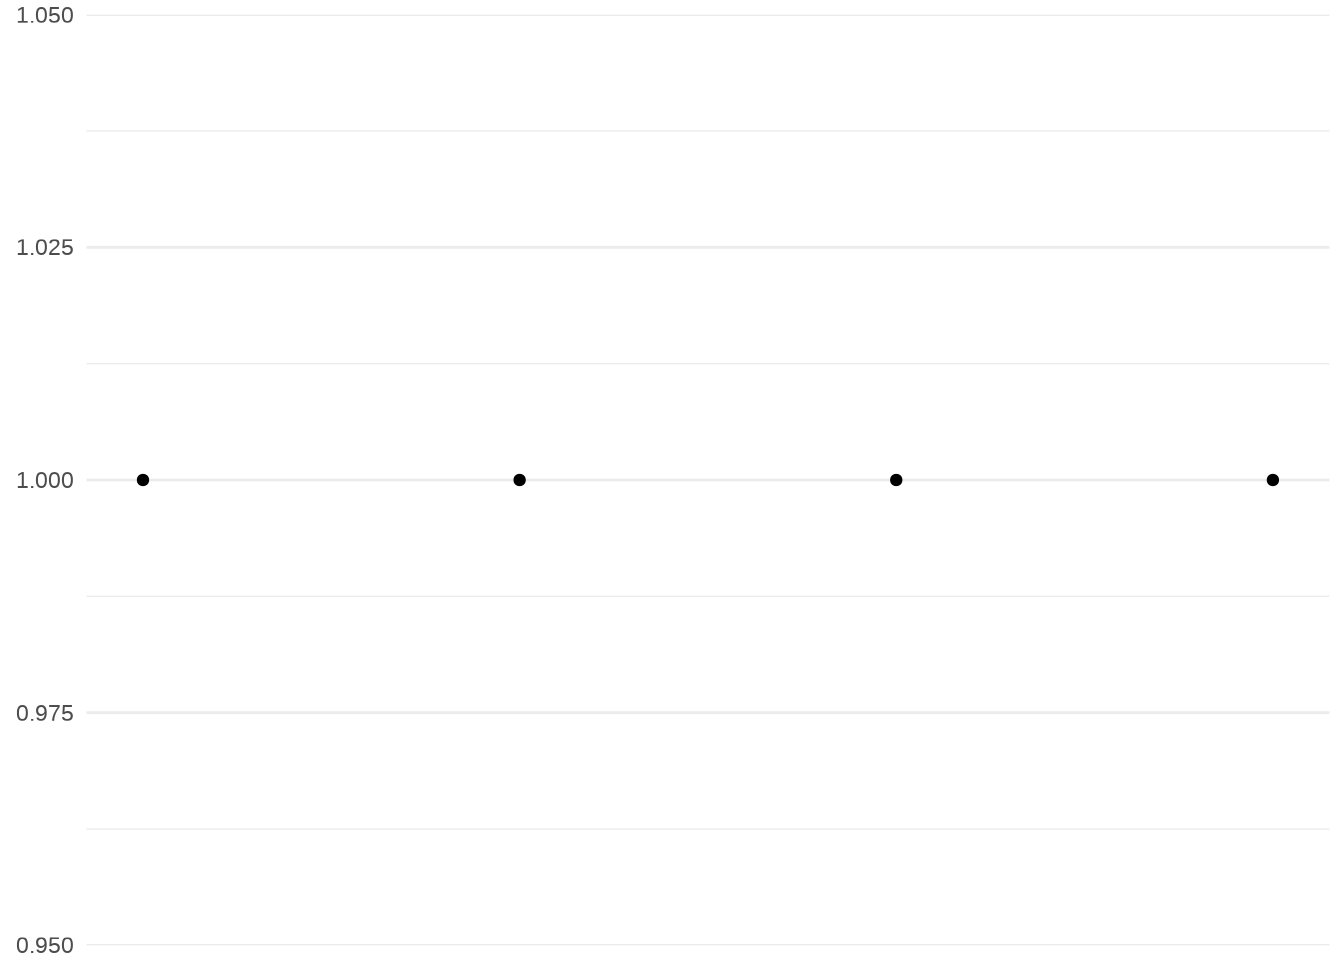
- Grid lines move along with breaks

You can pass a function to the argument
breaks, but the packagescaleshas several break functions that can help tweak the breaks:scales::breaks_extended()creates automatic breaks for numeric axes.scales::breaks_log()creates breaks appropriate for log axes.scales::breaks_pretty()creates “pretty” breaks for date/times.scales::breaks_width()creates equally spaced breaks.
Other breaks:
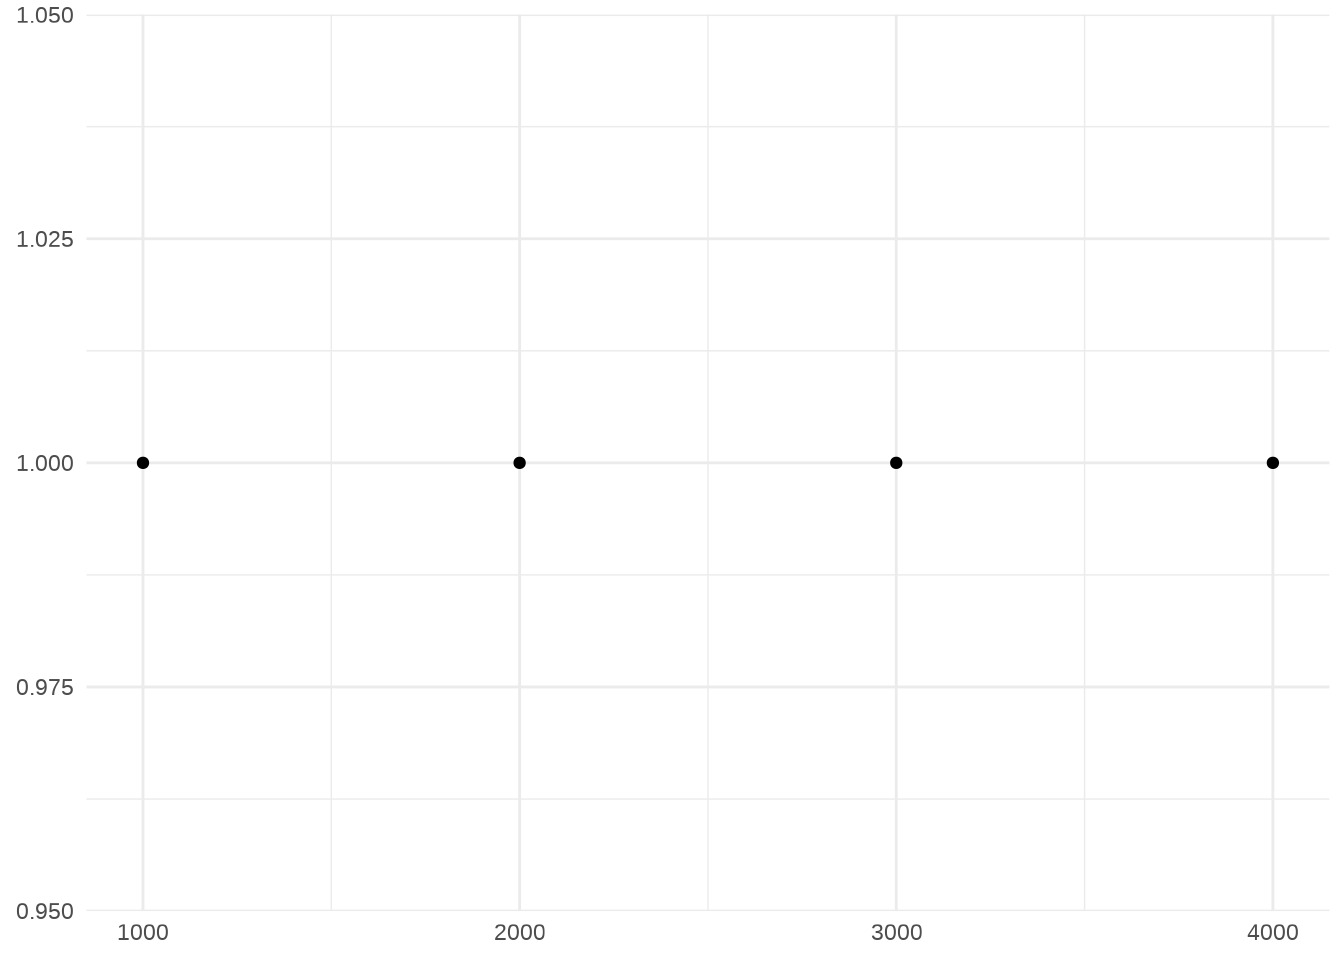
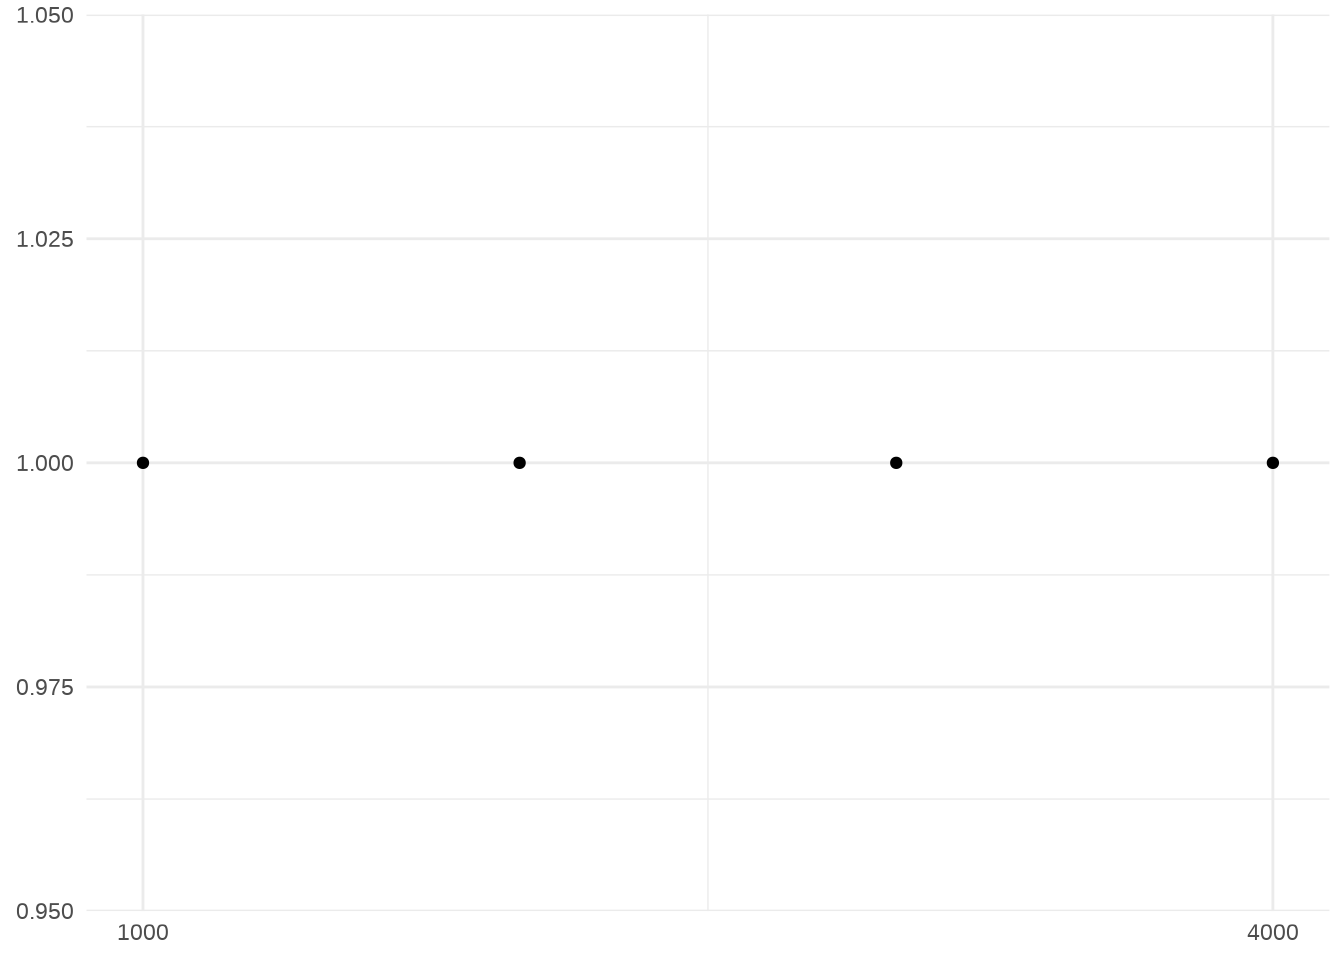
- With the
scales::breaks_width()function you can define the spacing between breaks.widthsets the distance between each break. Number or time/date in a single string in the form “{n} {unit}”, e.g., “1 month”, “4 sec”.offsetuse if you don’t want breaks to start at zero, or on a conventional date or time boundary such as the 1st of January or midnight. A negative number for offset will specify a new starting point with an offset away from the original one.

